The Strait of Hormuz is still closed, and we have 9 huge stories to cover on today’s Energy News Beat Stand Up. I am calculating that $82 will be the new floor once the tankers are rolled out of the Persian Gulf and refilled. Goldman Sachs says that if the Strait is not open within 30 days, we will see $100 oil for the rest of 2026. I think we will see it drop to $82 and average out over time, as markets stabilize.
California is the huge thorn in President Trumps bohoncas right now. The US would be insulated as the world’s Energy Dominance Leader if California were in better shape.
I go through all of that and how I came up with those numbers.
1. Oil and Gas Market Dynamics
The conversation extensively covers the energy market, including:
- Potential impacts of Strait of Hormuz closure on oil pricing (predictions of $82 floor and $100 as a possibility)
- Global supply disruptions from Middle East production shutdowns
- Refining capacity constraints in the Gulf region due to physical attacks
- OPEC production trends and market implications
2. Geopolitical Tensions and Energy Security
A significant focus on how international conflicts affect energy markets:
- U.S./Israel-Iran conflict and its ripple effects on global energy supply
- Analysis of how major oil corporations (Exxon Mobil, Chevron) are positioned amid tensions
- Potential peace scenarios linked to Venezuela sanctions
3. Data Center and Energy Infrastructure Expansion
Discussion of rapid infrastructure growth in the U.S.:
- Explosive expansion of data centers, particularly in Texas
- Strain on state power grids from this growth
- Comparative analysis of data center development across Texas, Virginia, and Georgia
4. Renewable Energy and Subsidy Policy
Critical examination of renewable energy economics:
- Long-standing wind farm subsidies and their effectiveness
- Challenges of pricing energy while accounting for externalities
- Feasibility of meeting 100% energy demand through wind and solar
1.It Will Take Months for the Oil, Gas and LNG Markets to Stabilize, and the New Floor Is Around $82
The Scale of the Shut-Ins: 9.1 Million Barrels per Day in April
According to the EIA’s April Short-Term Energy Outlook:
March 2026: Iraq, Saudi Arabia, Kuwait, UAE, Qatar, and Bahrain collectively shut in 7.5 million bpd of crude.
April 2026: The figure rises to a peak of 9.1 million bpd — equivalent to nearly 10% of global oil supply.
May onward (assuming ceasefire by end-April): Shut-ins ease to 6.7 million bpd, with a slow ramp-back to pre-war levels only by late 2026.
This is on top of the near-total paralysis of the Strait of Hormuz, which normally carries ~20% of global seaborne oil and LNG. The International Energy Agency (IEA) has labeled it “the largest supply disruption in the history of the global oil market.”
Refining Capacity Hit: ~2 Million Barrels per Day Offline
Physical attacks and precautionary shutdowns have idled 1.9–2.35 million bpd of Gulf refining capacity (per IIR and Reuters estimates). Key facilities affected include:
Saudi Aramco’s Ras Tanura (550,000 bpd) — temporarily halted, partial restart reported.
UAE’s Ruwais complex — fires and precautionary closure.
Bahrain’s Bapco Energies (400,000 bpd) — force majeure declared after damage.
Additional outages in Iraq, Kuwait, Qatar and other Saudi sites.
Downstream product markets (gasoline, diesel, jet fuel) are tightening faster than crude in some regions, amplifying the pain for importers in Asia and Europe.
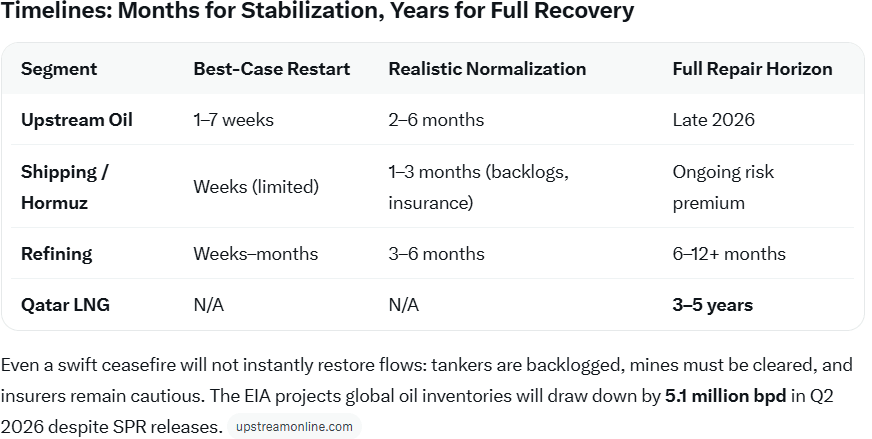
LNG Shock: 12.8 Million Tonnes per Annum (MTPA) Destroyed for Years
Iranian strikes on Qatar’s Ras Laffan Industrial City knocked out two LNG trains, removing 12.8 MTPA — or 17% of Qatar’s total LNG capacity. QatarEnergy CEO Saad al-Kaabi confirmed repairs will take 3–5 years due to critical turbine and heat-exchanger shortages. This single event has:
Triggered force majeure on long-term contracts to China, South Korea, Italy, and Belgium.
Removed the equivalent of ~3–4 LNG cargoes per day from global trade.
Pushed Asian and European spot LNG prices up sharply (some sessions +35%).
Qatar normally supplies ~20% of world LNG; the outage has tightened the market for the foreseeable future.
Even a swift ceasefire will not instantly restore flows: tankers are backlogged, mines must be cleared, and insurers remain cautious. The EIA projects global oil inventories will draw down by 5.1 million bpd in Q2 2026 despite SPR releases.
OPEC Production Charts: Pre-War vs. Current Reality
Chart 2: Gulf OPEC Countries Oil Production (Million bpd)
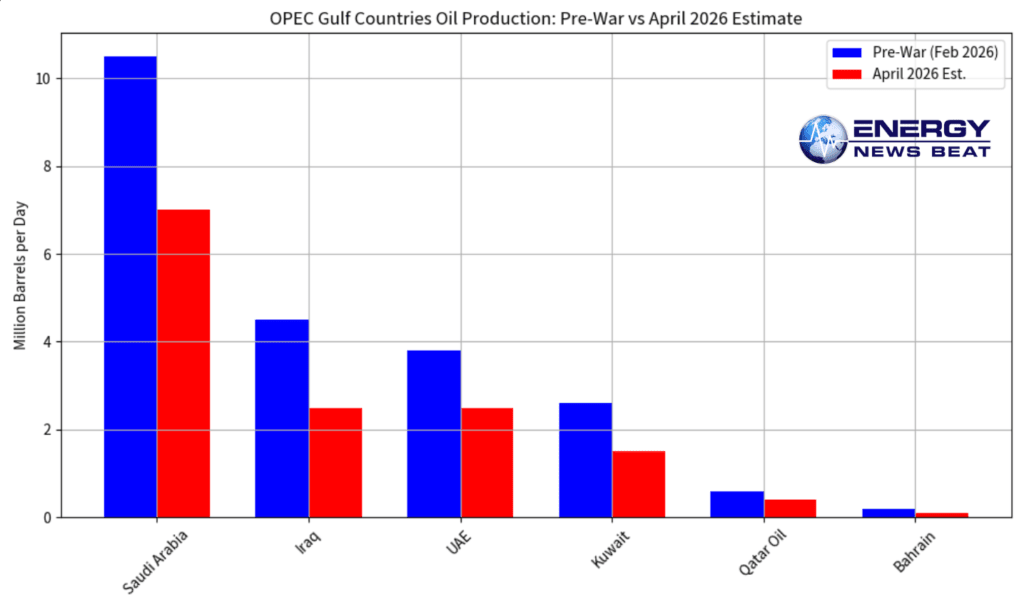
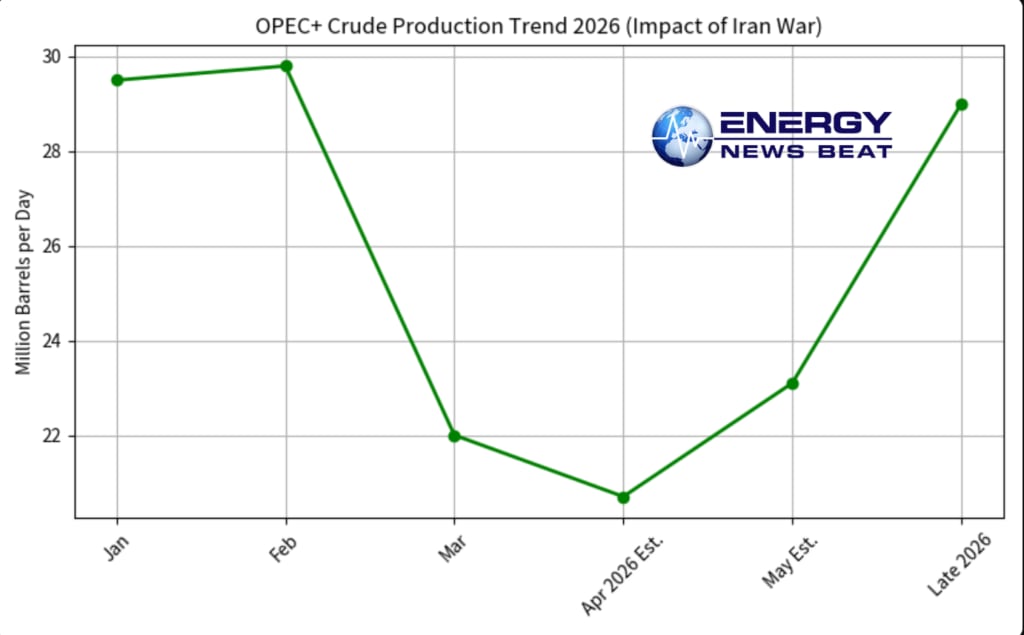
Chart 3: OPEC+ Crude Production Trend 2026 (Million bpd)
The charts illustrate the sudden ~9 million bpd drop and the slow multi-month climb back toward pre-war levels.
Price Outlook: $82 Becomes the New Floor
Brent crude has traded above $110 in recent weeks but eased on ceasefire talks. Forward curves and analyst consensus (EIA $96 average for 2026 Brent) now embed a persistent $10–15/bbl risk premium. Multiple houses see $82 as the new technical and fundamental floor once initial panic subsides and partial Gulf supply returns — well above the pre-war $60–70 range. Higher prices will incentivize U.S. shale, Canadian oil sands, and non-OPEC growth, but the structural Middle East premium is here to stay.
Bottom Line
The Iran war has removed ~9.1 million bpd of oil, ~2 million bpd of refining, and 12.8 MTPA of LNG for years. Shipping and confidence will take months to normalize; full LNG repairs will take years. Markets are already pricing in a higher-for-longer regime, with $82/bbl emerging as the new oil-price floor.
2.The Saudi East-West Pipeline has been attacked. Still functional, and damage assessment is underway.
The pipeline is deeply buried, and only the substations are vulnerable to drone attacks. It is already repaired and moving oil.
3.ExxonMobil Sees 6% of Global Output Impacted by Iran War, But What Does This Mean for Q1 and Q2?
4.Goldman Says Another Month Means Over $100 Brent Through 2026
5.JP Morgan’s Letter to Investors: Implications and Actions
6.How will the global oil and gas markets look post Iran War
7.Chevron Faces Smaller Mideast Disruptions Than ExxonMobil Amid Iran War – A Side-by-Side Comparison
8.Texas is leading in AI and Data Centers, but at what cost?
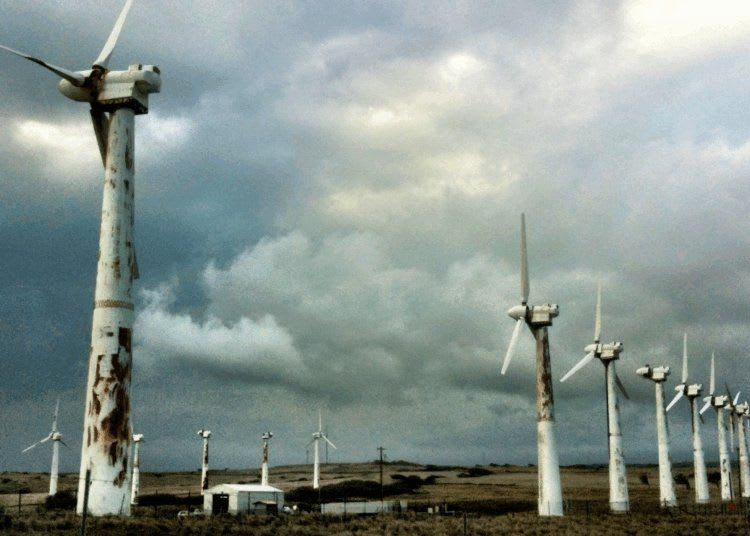
This is for our great Subscribers fighting wind and solar farms.
9.Wind Farms Have Had 50 Years of Subsidies: Should We Rethink How Energy Is Priced?
A recent clip from Net Zero Watch highlights a pointed question from Reform Scotland leader Malcolm Offord: Why are wind farms still being subsidized after decades of support? “Wind farms arrived 30 years ago, and they were given a 15-year subsidy,” Offord noted. “After 15 years, they’re given another 15-year subsidy, and then last month they’re given 20 years more subsidy. So that’s 50 years of subsidy.”
Offord’s remarks, made during a podcast discussion, underscore a broader frustration: despite promises that wind power would become the “cheapest form of energy,” massive ongoing subsidies, grid upgrades, and constraint payments continue to flow into the sector—costs ultimately passed on to consumers. In Scotland, where onshore and offshore wind have boomed, the real-world impacts are stark. This pattern repeats in the United States, where federal tax credits prop up wind generation while grid integration and resiliency costs are socialized across ratepayers. It’s time to ask: Should we rethink how we price energy by updating metrics like the Levelized Cost of Energy (LCOE) to reflect full system costs?
“Why are wind farms still being subsidised? Wind farms arrived 30 years ago, and they were given a 15 year subsidy… After 15 years, they’re given another 15 year subsidy, and then last month they’re given 20 years more subsidy. So that’s 50 years of subsidy.” @Malcolm_Offord pic.twitter.com/JlNWBA3ahe
— Net Zero Watch (@NetZeroWatch) April 8, 2026
Scotland’s Wind Boom: Subsidies, Curtailment, and Soaring Consumer Costs
Scotland has aggressively pursued wind energy, positioning itself as a renewable leader. Yet the results have not matched the hype. Massive constraint (curtailment) payments—where operators are paid to shut down turbines because the grid cannot handle excess generation—have become routine. In recent years, Scottish wind farms have received hundreds of millions in such payments annually. UK-wide curtailment costs hit roughly £1.5 billion in 2025 alone, with the vast majority tied to Scottish wind output (often 98% of curtailed volume). Projections suggest these could reach £8 billion by 2030 without reforms.
Wind Power in the United States: Subsidies Without Full Accountability
The U.S. wind industry tells a parallel story. Installed wind capacity has grown dramatically, driven by federal incentives. The Production Tax Credit (PTC) remains the cornerstone: for qualifying projects, it provides up to ~2.75–3 cents per kWh (inflation-adjusted, higher with prevailing wage/apprenticeship requirements under the Inflation Reduction Act). This credit applies for 10 years after a facility comes online.
Because the PTC is production-based, operators can bid electricity into wholesale markets at zero or even negative prices and still profit, distorting price signals and making it harder for dispatchable (reliable, on-demand) generation to compete. Power Purchase Agreements (PPAs) often lock in payments, but the subsidy layer allows wind to underbid true marginal costs.
Crucially, wind developers are rarely charged directly for the full costs they impose on the grid. Two major gaps stand out:Transmission and Interconnection Costs: In Texas—the nation’s wind leader—the Competitive Renewable Energy Zones (CREZ) initiative built ~$6.9–7 billion in new high-voltage lines specifically to deliver remote West Texas wind to population centers. These costs were socialized across ERCOT ratepayers via transmission charges, not borne by wind developers. Ratepayers have shouldered nearly $15 billion in such renewable-related transmission investments since 2010 (adjusted figures show a 57% real increase in per-customer transmission charges). Ongoing and planned upgrades could push annual transmission costs beyond $12 billion by the early 2030s, adding at least $100 annually to average residential bills.
Grid Resiliency and Balancing Costs: Wind’s intermittency requires backup generation, storage, or demand response to maintain reliability. These “system integration” costs—ancillary services, congestion management, and reliability adders—are largely socialized. ERCOT has seen billions in annual congestion costs, partly driven by variable renewable output. Wind farms contribute to—but are not directly charged for—the need for additional dispatchable capacity or storage to keep the lights on during low-wind periods.
In short, wind receives guaranteed production subsidies while the downstream costs of integration, resiliency, and infrastructure are spread across all ratepayers and taxpayers.
Redefining the Levelized Cost of Energy: Time for a Full-System View
The standard LCOE metric—widely cited to claim wind is now “cheaper” than fossil fuels—calculates only the plant-level costs of building and operating a generator over its lifetime, divided by expected output. It ignores critical system-wide realities: transmission upgrades, grid balancing, backup capacity for intermittency, and resiliency needs during low-output periods.
Analysts increasingly call for a “Levelized Full System Cost of Energy” (or System LCOE / LFSCOE) that internalizes these externalities. Studies using this approach show wind and solar costs rise dramatically when forced to supply 100% (or even 95%) of demand in isolation. In Texas (ERCOT), for example, wind’s full-system costs can exceed those of natural gas or even nuclear when balancing and storage requirements are included. Even with steep storage cost reductions, renewables struggle to compete on a true apples-to-apples basis.
Energy News Beat has previously advocated updating LCOE to a “Levelized System Cost of Energy” that explicitly includes integration, balancing, storage, and resiliency charges. Policymakers should require this fuller accounting in procurement decisions, rate cases, and subsidy evaluations. Only then can markets send accurate price signals and ensure consumers pay the real cost of the energy mix they receive.
Around the Corner Podcasts
We have Jon Brewton, with Data2, next week, and on the California Crisis, Professor Mische, David Blackmon, and Mike Areiz.
Tomorrow, we are releasing Jason Arceneaux, President and Chairman of the Board for Arc Energy, and we will cover the global oil markets.
Check out The Energy News Beat Substack

Also, a shout-out to our great Sponsors:

A shout-out to Steve Reese and the Reese Energy Consulting group for sponsoring the Podcast https://reeseenergyconsulting.com/.

A shout-out to our New Sponsor, Data2 – We will be running an AI Centered Series and have lots of data rolling out!. https://www.data2.ai/resources/the-decision-lag-report

And we have WellDatabase rolling in as a new sponsor, and we will be getting their information next week.
The post The Strait of Hormuz is still closed, and $82 is the Floor, and Goldman says we may see $100 for the rest of 2026 appeared first on Energy News Beat.