
This article first ran on The Energy News Beat Substack – Head over there to comment.
The global oil market is once again being reshaped by simultaneous disruptions across multiple critical maritime and pipeline choke points. As of late July 2026, the Bab el-Mandeb Strait, Strait of Hormuz, Suez Canal routes, and Caspian-linked export corridors are all under severe pressure. These bottlenecks are restricting normal seaborne and pipeline flows, forcing tankers onto longer routes, inflating freight and insurance costs by millions of dollars per voyage, and stretching delivery times by weeks.
The result is a widening gap between paper (futures) prices and the true cost of physically delivered barrels, with refiners scrambling for alternatives and producers outside the danger zones positioned to gain.
The Choke Points Under Pressure
The Strait of Hormuz, which normally handles roughly 20% or more of global seaborne oil, has seen traffic collapse. Verified vessel crossings recently dropped to as few as 30 over multi-day periods versus the pre-escalation norm of 125–140 per day. This stems from the ongoing U.S.-Israel-Iran confrontation, including sustained U.S. strikes and threats of larger action, which have left shipping companies hesitant and diplomatic efforts stalled.
In the Bab el-Mandeb Strait, Yemen’s Houthis declared a maritime embargo targeting Saudi Arabia and its allies around July 20, 2026. This route moves about 4.5 million barrels per day and accounts for roughly 75% of Saudi exports via the Yanbu terminal on the Red Sea. Enforcement has been selective—Chinese-flagged or owned vessels have been allowed passage—while others divert, further tightening available capacity.
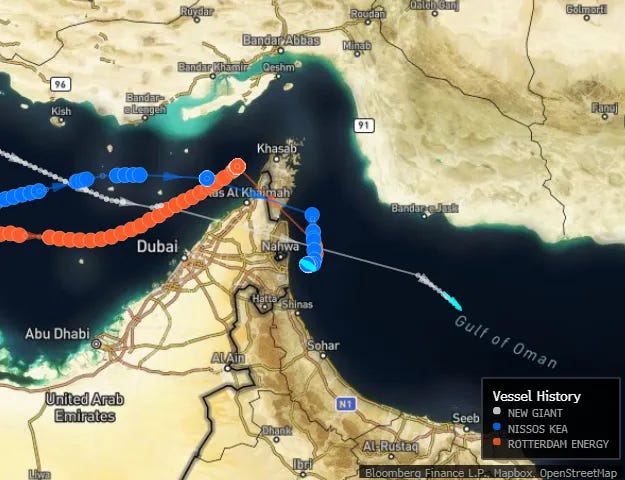
Suez Canal and Red Sea traffic, already strained by prior Houthi activity, faces knock-on effects. Some oil flows have shifted toward Suez as Gulf loadings are constrained, temporarily boosting canal tanker traffic in earlier months, but risks persist and many operators continue Cape of Good Hope diversions.
Saudi Arabia’s Red Sea Exit and the SUMED Bypass:
Capacity Limits and Tanker Economics
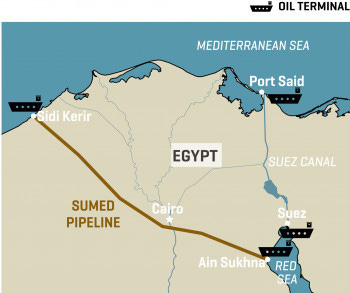
Faced with simultaneous pressure on the Strait of Hormuz and Bab el-Mandeb, Saudi Aramco has leaned heavily on its Red Sea infrastructure and Egypt’s SUMED pipeline as critical workarounds. The accompanying map illustrates the SUMED (Suez-Mediterranean) Pipeline system: crude is discharged at Ain Sukhna on the Red Sea, moved northward via the pipeline across Egypt, and reloaded at Sidi Kerir on the Mediterranean for onward shipment to Europe or further afield—effectively bypassing full transit of the Suez Canal for very large crude carriers (VLCCs).Yanbu Terminal Capacity (Saudi Arabia’s primary Red Sea exit port)
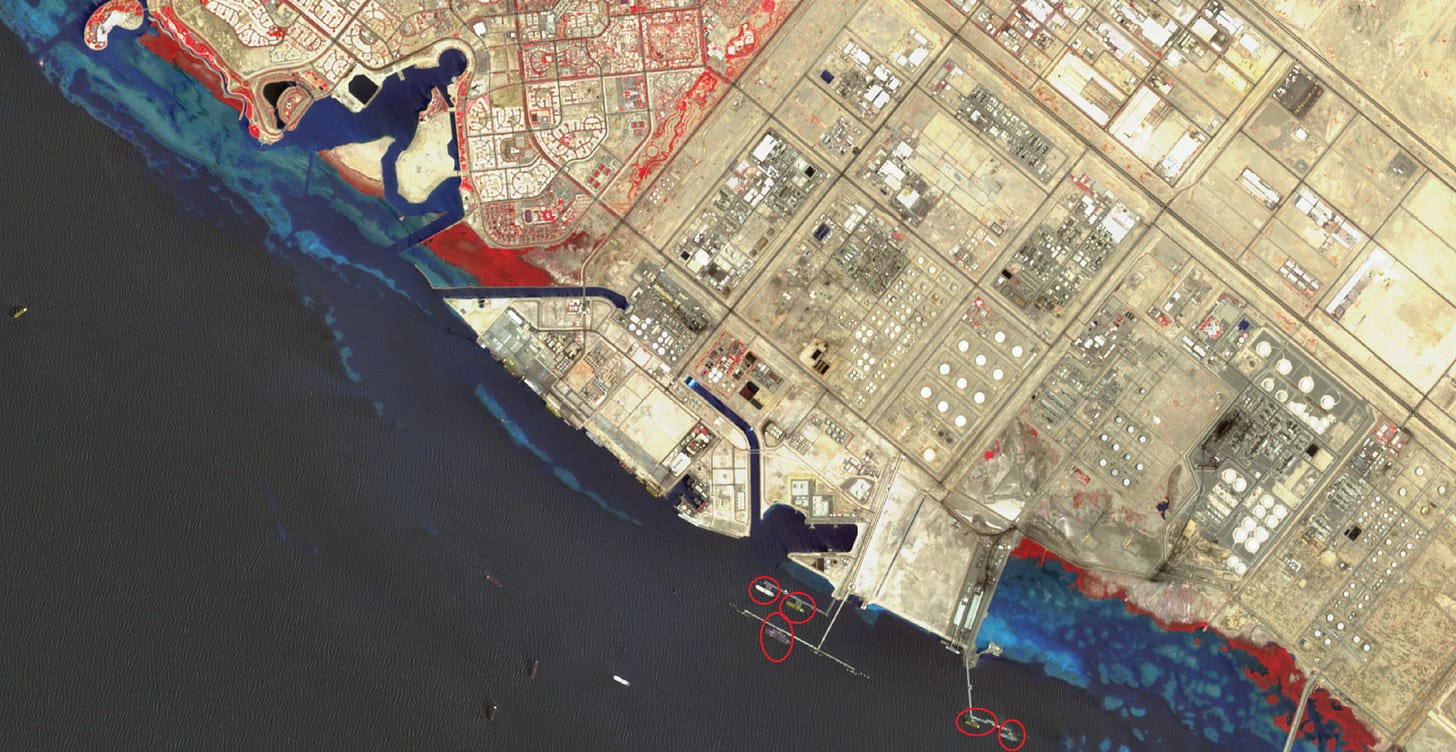
Aramco’s East-West Pipeline (Petroline) can move up to approximately 7 million barrels per day (bpd) from the Eastern Province oil fields to the Yanbu area on the Red Sea. Roughly 2 million bpd typically supplies local Red Sea refineries, leaving theoretical export capacity of around 5 million bpd.
Yanbu’s two main loading terminals (Yanbu North and Yanbu South) have a nominal combined capacity of about 4.5 million bpd. In practice, under sustained high utilization and wartime conditions, effective operational throughput has been estimated in the 3–4 million bpd range by analysts (Vortexa, Argus), although Aramco has publicly targeted closer to 5 million bpd of crude exports from the complex during peak crisis periods in 2026. Storage and berth constraints, grade limitations, and the need to prioritize certain crudes (Arab Light and Extra Light) prevent the full pipeline volume from being loaded continuously. Historical pre-crisis loadings from Yanbu were typically only 1–2 million bpd.
SUMED Pipeline Capacity
The SUMED system itself has a capacity of approximately 2.5 million bpd (some assessments cite up to 2.8 million bpd). It includes substantial storage (around 40 million barrels total across the terminals). This allows partial or full discharge of tankers at Ain Sukhna so that large VLCCs (which often cannot transit the Suez Canal fully laden due to draft restrictions) can lighten their loads, move the oil by pipeline, and reload on the Mediterranean side. Saudi crude has been among the volumes using this route as a strategic alternative when Red Sea and Hormuz risks escalate.
These facilities provide meaningful but limited relief. Even at maximum practical rates, Yanbu + SUMED cannot fully replace the much larger volumes that normally move through the Persian Gulf terminals and the Strait of Hormuz.
Shipping Costs for a Typical VLCC Tanker
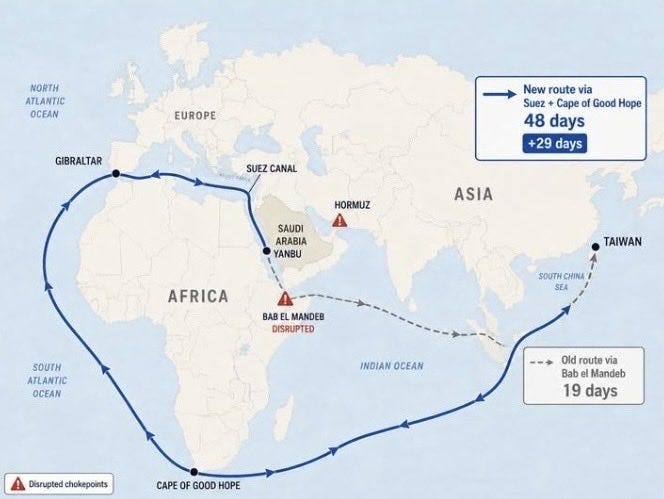
A standard VLCC carries roughly 2 million barrels. Under normal conditions, a voyage from Saudi Arabia’s Yanbu terminal to Asia (e.g., Taiwan or China) via the Bab el-Mandeb takes about 19 days. When forced to divert around the Cape of Good Hope (or a longer Mediterranean–Gibraltar–Cape combination), the voyage stretches to approximately 48 days—an added month at sea. Incremental costs for such a diversion have been calculated at roughly $2.5 million per tanker, driven by: Fuel costs roughly doubling (from ~$1.26 million to ~$2.87 million on the longer route).
Suez Canal transit fees of around $1 million when that option is still used for part of the journey.
Additional insurance (war-risk premiums), demurrage, and operating expenses.
Spot freight rates themselves have been extremely volatile in 2026. At peaks during the Hormuz/Red Sea disruptions, daily time-charter equivalent rates for VLCCs on Middle East–Asia routes surged to $170,000–$400,000+ per day (with some fixtures reported near $770,000/day). Full voyage freight costs on the longest diversions have reached the tens of millions of dollars in extreme cases, translating to an extra $10–15+ per barrel in some reported fixtures.
These elevated shipping costs are a direct contributor to the wide paper-versus-physical price gap: the delivered cost of physical oil rises sharply even if the FOB price at the loading terminal does not increase by the same amount.
In short, while Yanbu and the SUMED pipeline offer Saudi Arabia important redundancy (potentially moving 3–5 million bpd of exports plus pipeline bypass capacity), the absolute volumes remain constrained relative to normal Gulf loadings. Every diverted tanker incurs multi-million-dollar extra costs and multi-week delays, reinforcing higher physical delivery prices, deeper backwardation, and the structural advantage for producers (such as those in Argentina’s Vaca Muerta) whose barrels never encounter these choke points. We will cover that in a moment.
Finally, Caspian oil is feeling the squeeze through the Caspian Pipeline Consortium (CPC). Ukrainian attacks on tankers at the Black Sea terminal near Novorossiysk have forced Kazakhstan to halt or severely curtail pipeline deliveries of Caspian crude (including CPC Blend, which moves around 1.5 million barrels per day or more when fully operational). Tanker operators are refusing to load, effectively choking a key non-Middle East export route.
Collectively, these three primary maritime valves plus the Caspian/Black Sea corridor handle nearly half of the world’s seaborne oil under normal conditions. With all contested at once and spare OPEC capacity limited, the physical market has tightened sharply.
And as I talked about the Panama Canal, they are having issues, adding days and weeks to tanker times. They are in a drought, and it is causing a huge red flag.
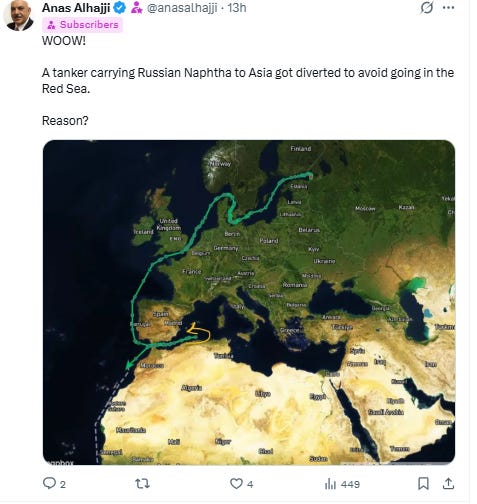
Anas Alhajji Alhajji, whom I highly recommend you subscribe to, just pointed out a huge issue. Russia is turning tankers around in the Mediterranean and adding thousands of miles and ultimately millions to the delivery costs. He is one of the key voices I listen every chance I get.
Rising Transit Costs and the Physical Market Squeeze
Rerouting adds substantial time and expense. A typical voyage from Saudi Red Sea ports to Asia that once took about 19 days can stretch to 48 days via the longer Cape route, adding roughly a month at sea. Fuel costs alone can more than double (to around $2.87 million in one calculation), Suez fees (when usable) add further hundreds of thousands to a million dollars, and total incremental costs reach about $2.5 million per tanker—or more when insurance war-risk premiums and demurrage are included. Freight rates on key routes have exploded; U.S.-to-Asia VLCC charters have hit records near $29 million in related periods.
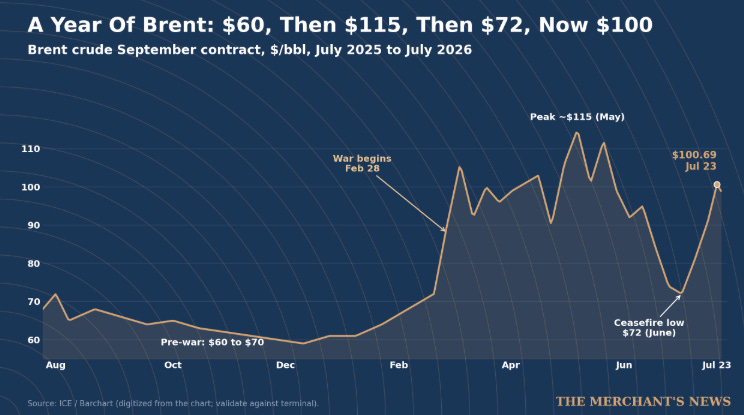
These higher landed costs are reflected in the physical market. Front-month Brent has traded near or above $100 recently (closing near $100.7 after a sharp jump, though fluctuating around the high $90s on July 24), up roughly 30% or more over the past month.
The curve has flipped into backwardation—prompt barrels commanding a premium to later months—signaling immediate scarcity rather than distant fear. “Panic across the board” has been used to describe timespreads. Paper futures often lag the true physical delivery premiums paid by refiners desperate for prompt, usable barrels.
Again, hat tip to (Jack) Giacomo Prandelli The Merchant’s News Substack.
India’s state refiners (Indian Oil, Bharat Petroleum, Hindustan Petroleum) illustrate the scramble. They have been securing extra spot cargoes amid fears that Saudi and Iraqi Middle East shipments may not arrive on schedule, highlighting how even major buyers are hunting alternatives as traditional flows choke.
How Prices Balance: Higher Transit Costs, Producer Netbacks, and Market Clearing
Higher transit costs raise the delivered (CIF) price of oil. Refiners and end-users pay more for physical barrels that actually arrive. In theory, producers whose routes are blocked or riskier must accept lower free-on-board (FOB) netbacks—effectively discounting their crude—to remain competitive against unobstructed supplies. Otherwise, cargoes simply do not move, inventories build at origin, and volumes fall.
In practice, the simultaneous multi-choke-point pressure reduces overall effective supply more than any single producer can offset by discounting. With limited spare capacity and diversions tying up tanker fleets longer, the global balance tightens. Physical prices rise, backwardation deepens, and the paper market eventually follows (or the gap persists while shortages are acute). Safe producers do not need to cut prices as aggressively; they capture the elevated global benchmark plus any regional premiums.
Demand-side responses help clear the market: weaker Chinese imports in some periods reduce pull, while higher prices eventually encourage demand destruction or efficiency. But near-term, the shortage is real and immediate.
Argentina as a Clear Winner Outside the Choke Points
Producers sitting on oil in safe, export-connected locations benefit most. Argentina stands out. Its Vaca Muerta shale has driven national oil output to records near 850,000–880,000 barrels per day in recent months (with shale contributing over 70%), and further growth is underway toward 1 million bpd later this decade.
Exports flow to the Atlantic without dependence on Hormuz, Bab el-Mandeb, Suez, or Black Sea routes. Low lifting costs (often cited in the low single digits to mid-single digits per barrel in efficient operations) and major infrastructure investments (pipelines, processing, LNG ambitions) position the country to monetize high prices directly.
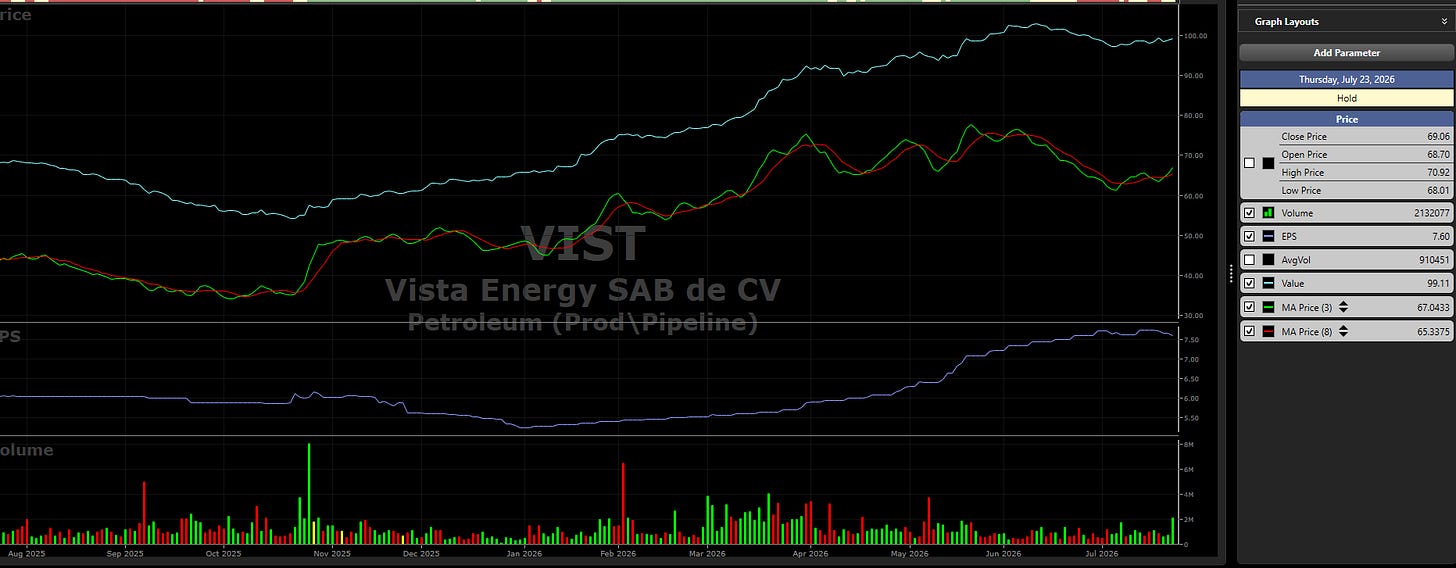
Source: VectorVest and Energy News Beat.
Jack Prandelli has highlighted this dynamic repeatedly: capital and order books are rotating toward the Atlantic basin, where barrels avoid the contested choke points. Investments from majors, ADNOC-linked entities, and others into Vaca Muerta underscore the shift. At elevated oil prices, Argentina’s producers and the broader economy capture upside without the same transit penalties or geopolitical discounts faced by Middle East or Caspian suppliers.
Impacts on Consumers and Investors
Consumers face higher pump prices, elevated electricity and industrial energy costs, and broader inflationary pressure—particularly in import-dependent Asia and Europe. Refining margins can widen temporarily on product cracks, but feedstock scarcity and freight ultimately pass through to end-users. Vulnerable economies risk slower growth or recession if the disruption prolongs.
Investors encounter heightened volatility but also clear opportunities. Energy equities, especially those with production outside the choke points (Atlantic basin, U.S. shale, select South American names), tend to outperform. Tanker companies and midstream operators benefit from elevated freight and utilization. Paper markets may lag physical reality, creating potential for violent catch-up moves higher if shortages persist.
Conversely, any de-escalation could trigger sharp reversals. Portfolio diversification into resilient supply sources and careful monitoring of physical differentials versus futures remain essential.
The current configuration—multiple choke points constrained simultaneously, rising transit friction, and a persistent paper-physical gap—points to elevated and volatile oil prices until either military/diplomatic resolution restores flows or new safe supply meaningfully offsets the lost barrels.
Argentina and similar non-exposed producers are structurally advantaged in this environment.
We do not give investment advice, and retail traders have not fared well this year.
What is certain is the uncertainty in the markets. – Stu Turley
This is going to get bumpier very quickly, but investing in US assets, your own family’s emergency supplies, and physical assets is always a good suggestion. I still believe the world will heal, as more evil is made public, but the markets have never been shaken like this before.
I have never seen so many short oil bets, or markets that don’t make sense. Demand destruction is kicking in, and paper will catch up to physical. Physical delivery is now averaging $140, and I have seen higher for delivered oil. Demand destruction will reduce that number, and I still see the $80 to $90 range holding for longer.
When, I can’t say, but just looking at the extra costs for tankers, insurance, and time on water, it does not look soon. There is no glut, and India is the swing refining country right now, and they are hunting for barrels of oil that are months away. Let that sink in.
Get ready for a fun weekend, and honestly, take a moment to see how your home is set up for blackouts and natural disasters.
Appendix: Sources and Links
- Bloomberg: India State Refiners Hunt for Crude as Middle East Flows Choked (July 24, 2026) – https://www.bloomberg.com/news/articles/2026-07-24/india-state-refiners-hunt-for-crude-as-middle-east-flows-choked?srnd=phx-industries-energy
- Jack Prandelli / The Merchant’s News: Who Wins At $100 Oil When The Tools To Cap It Are Spent? (July 24, 2026) –

- Reuters: Add a month at sea and $2.5 million – what it costs oil tankers to flee Hormuz and Bab el-Mandeb (July 23, 2026) – https://www.reuters.com/business/energy/add-month-sea-25-million-what-it-costs-oil-tankers-flee-hormuz-bab-el-mandeb-2026-07-23/
- Bloomberg: Kazakh Oil Flows to Black Sea Forced to Stop as Tankers Hit (July 21, 2026) – https://www.bloomberg.com/news/articles/2026-07-21/kazakhstan-to-stop-piping-oil-to-black-sea-after-tanker-attacks
- Reuters / related: Caspian Pipeline Consortium oil loadings suspended after drone attacks (July 19, 2026)
- OilPrice.com and related coverage on Argentina Vaca Muerta production records and export potential (2026 articles)
- Trading Economics / ICE / Investing.com data on Brent crude prices around July 24, 2026
- Additional context from S&P Global, IEA Oil Market Report (July 2026), and shipping analyses on Hormuz/Suez diversions and freight rates
- Jack Prandelli X posts and related analysis on Argentina/Vaca Muerta investments and Atlantic basin advantages (May–June 2026)
The post Huge Geopolitical Impacts to Oil, Energy and Markets appeared first on Energy News Beat.