

Two oil giants are choosing different speeds in West Texas—not walking away from American energy. The real test is what survives the next price cycle.
By Energy News Beat | Planned Sunday November 8, 2026 issue | Facts researched November 7, 2026 CST
The family-budget question
When you pull up to the diesel pump, you are not shopping for an oil company’s growth strategy. You want fuel that is available and a bill that leaves something for groceries. But decisions being made in Houston and West Texas today help determine how much supply will be available years from now.
A provocative November 6 LinkedIn commentary, “Chevron Runs Permian for Cash, Exxon Bets the House,” frames a real disagreement about the next investment dollar. Its interpretation deserves a hearing. It is not proof that Chevron has lost faith in shale—or that ExxonMobil has put its entire future on one basin.
The latest released third-quarter results, both dated October 30, tell a more useful story: Chevron is working an above-one-million-barrel-equivalent Permian plateau for cash and efficiency. Exxon is pursuing a larger production runway, supported by technology and the Pioneer combination. Both are also investing internationally. Neither approach guarantees cheaper gasoline or a winning stock.
Chevron’s plateau is a strategy, not an exit
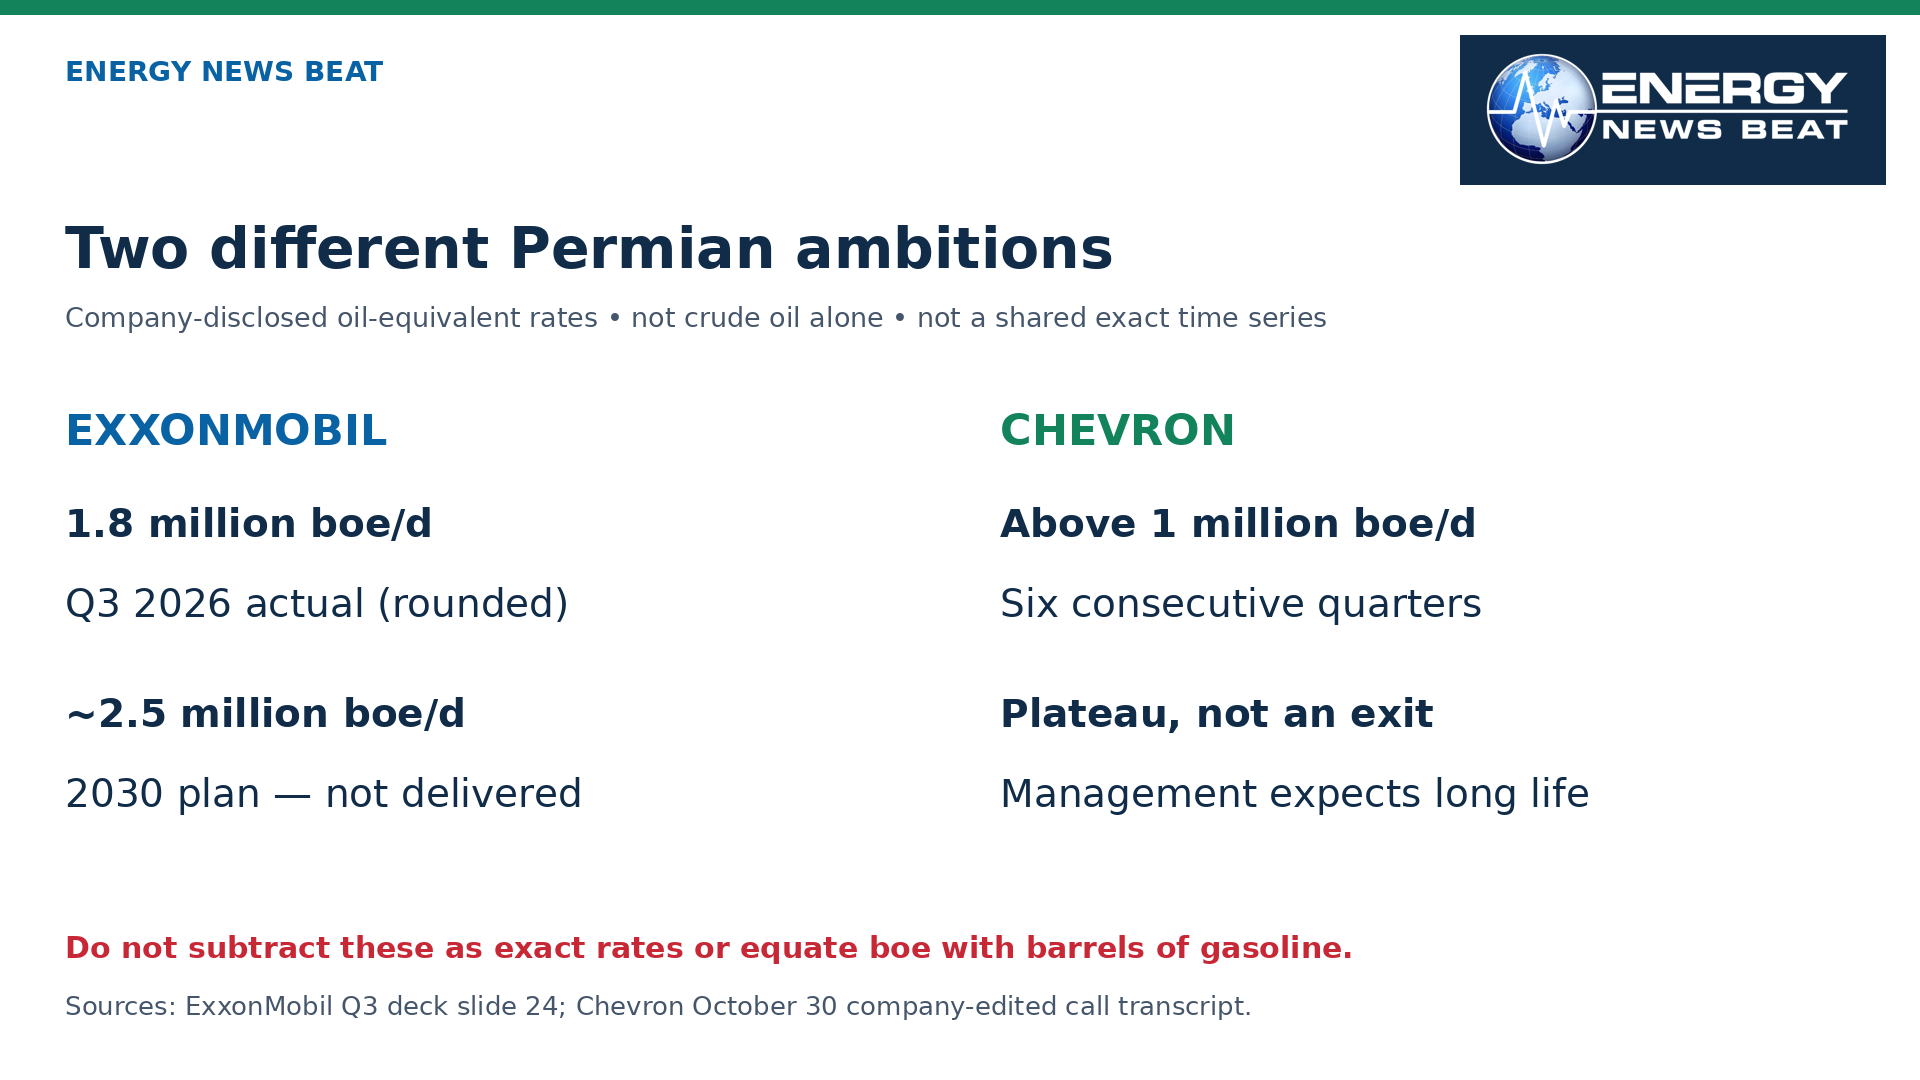
In Chevron’s company-edited earnings-call transcript, CFO Eimear Bonner said the Permian had recorded its sixth consecutive quarter above one million barrels of oil equivalent per day. CEO Mike Wirth said the plateau could last through the end of the next decade, and potentially longer. That is management’s expectation, not a guarantee through 2040.
Vice Chairman Mark Nelson put the objective plainly: “we continue to focus on maximizing free cash flow there.” He said Chevron has inventory to grow above that level, but expects fluctuations around the plateau. Crucially, he reported drilling-and-completion spending down 40% and facilities spending down 50%, while reinforcing a greater-than-25% improvement in capex per barrel of oil. Those are management’s comparative efficiency claims, not standardized peer cost rankings; the call does not supply every denominator and baseline needed to reconstruct them.
Flat output does not mean no drilling. Existing wells decline, so sustaining a plateau requires replacement supply and operating work. Nor does lower spending establish fewer rigs in equal proportion: faster drilling, longer wells and better completions can change the relationship. We have not established a current, comparable Permian rig-and-completion fleet count for both companies.
Exxon’s bigger runway still has to earn its keep
Exxon’s third-quarter presentation, slide 24 lists Permian production at 1.8 million oil-equivalent barrels a day for the quarter, approximately the same as its full-year 2026 plan, and approximately 2.5 million for 2030. That is about 0.7 million more than the rounded quarterly rate, or roughly 39%—a target, not delivered growth. Chevron’s “above one million” disclosure is not an exact matching data point, so this article does not manufacture a precise head-to-head Permian market-share chart.
On Exxon’s company-hosted call transcript, Darren Woods described three automated Permian drilling rigs in operation, with deployment expected to reach about a quarter of its fleet next year and half by 2028. That is the automation share, not a forecast of total rigs. He also emphasized that recovery improvements need time to show up across a large production base.
The Pioneer integration matters, but acquisition and organic growth are not interchangeable. The call describes an increase in estimated annual Pioneer synergies from $2 billion to $4 billion; it does not provide a standalone audited Permian cash-flow statement. Exxon’s December 2025 plan remarks describe roughly $30-a-barrel Permian cost of supply as a commodity price needed to generate at least a 10% return. The current deck says investment returns exclude prior exploration and acquisition costs. That is not an all-in shareholder breakeven, and it should not be ranked against a producer survey as if definitions matched.
The overseas choice is not either-or
Chevron’s quarterly release says its Venezuela joint ventures plan $7 billion of investment over five years. Its deck targets roughly 600,000 barrels of oil a day of gross joint-venture production by 2031; that is not Chevron’s net production, not a Permian boe comparison, and not a completed expansion. Management calls the program self-funding, but country terms, sanctions and execution remain risks rather than problems a spreadsheet can erase.
The Chevron call also describes TCO operating near full rates, discussions over extending Kazakhstan’s concession, and Iraq growth opportunities still under negotiation. These are not all equivalent to sanctioned capital projects. Meanwhile, Bakken changes following Hess show the company is still improving American shale economics, not simply sending every available dollar abroad.
Exxon’s release likewise reports agreed increases in working interests to 34% in Papua LNG and 50% in Rovuma LNG in Mozambique, alongside assuming operatorship at Papua. Those international positions rebut the idea of an exclusively Permian strategy. They also add project, partner and geopolitical exposure. More domestic shale can diversify overseas risks, even as a larger Permian position concentrates basin-specific risks.
Big company cash is not Permian cash
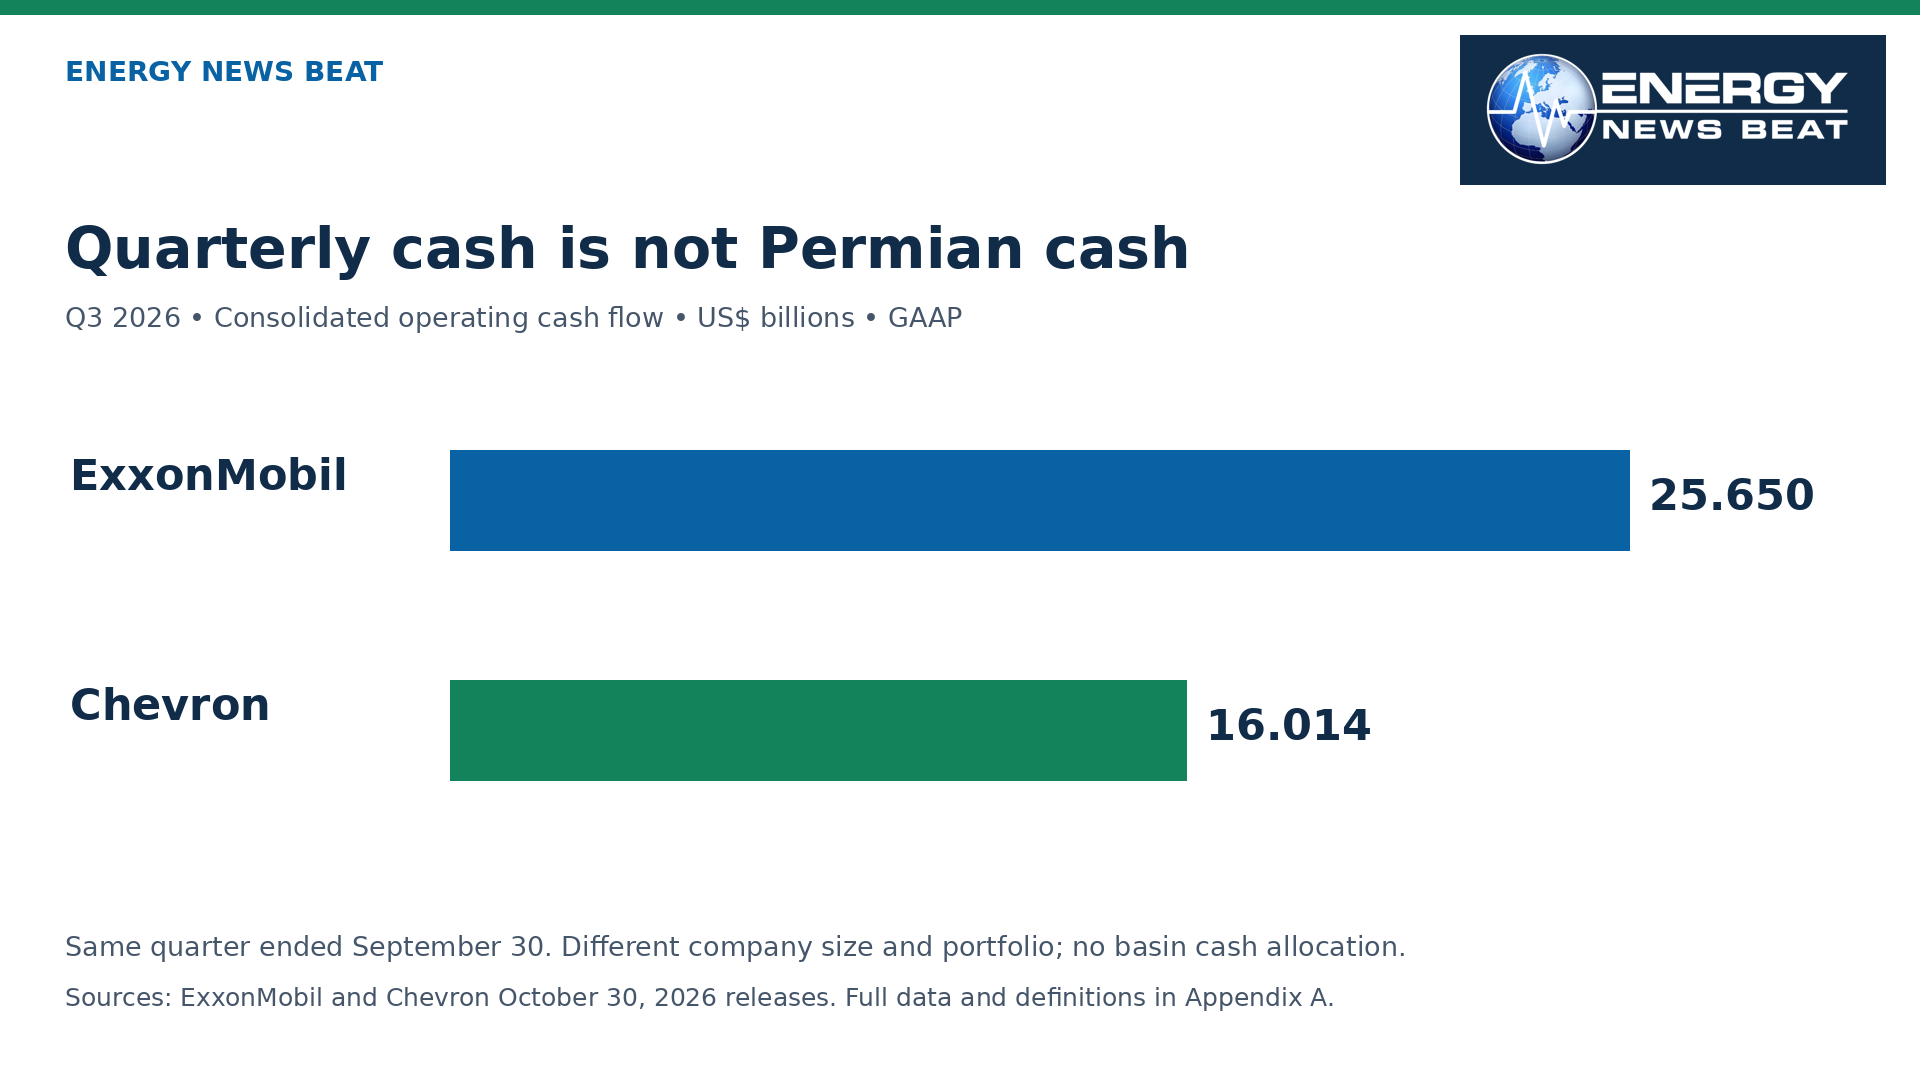
For the same three months ended September 30, Exxon reported $25.650 billion of operating cash flow and $15.413 billion of GAAP earnings. Chevron reported $16.014 billion and $9.924 billion, respectively. Exxon is larger; those totals do not settle which company earns a better return on the next West Texas well.
Chevron’s reported free cash flow was $12.003 billion, while adjusted free cash flow was $14.243 billion. The latter removes working-capital effects and adds asset-sale/return-of-investment proceeds and net affiliate-loan repayments. Exxon’s $19.109 billion free cash flow has its own investing-flow definition. Do not label the difference a Permian cash advantage. Even company-wide free-cash-flow comparisons need those definitions attached.
Who wins? Change the conditions, change the answer
Here is the honest scorecard, not a stock-price call. Over the next one to two years, a lower-price environment would reward whichever operator protects cash without damaging future supply. Chevron’s plateau efficiencies could help; Exxon’s scale and technology could help too. Without comparable basin cash costs and sustaining capital, declaring a dollar winner would be pretend precision.
Through 2030, if prices support development and Exxon delivers its 2.5-million-boe target efficiently, Exxon has the stronger disclosed Permian volume-growth proposition. If growth costs rise or recovery improvements disappoint, Chevron’s emphasis on cash and optionality could look better. Conversely, if international fiscal terms deteriorate or projects slip, Chevron’s overseas opportunities can disappoint even while its plateau works as planned.
For families, the winner is reliable, deliverable fuel—not a slide-deck trophy. Additional crude and gas can support supply, but pipelines, refinery yields, export flows and global disruptions determine what reaches the pump. Neither company disclosed a calculable household saving from its Permian strategy. Policymakers should favor predictable permitting and infrastructure while demanding environmental and operating accountability. Investors should demand measured returns after acquisition costs, not just bigger boe numbers.
Stu’s Take
I like American energy companies competing to get more value out of American resources. But I do not want us confusing a production contest with an affordability plan. Chevron keeping a large Permian business productive with less capital is not surrender. Exxon trying to recover more oil with better technology is not automatically reckless.
My test for both is straightforward: show us sustained results, explain what the cost numbers include, and do not ask families or investors to accept a barrel-equivalent headline as the whole story. We need dependable pipelines, responsible water management, reliable power and refineries that can turn supply into the fuels people actually use.
Overseas investments can add valuable supply and cash, but they carry political risks that belong in the conversation. I would rather see disciplined, durable production on both sides of this comparison than crown a winner before the returns arrive. Let the companies prove their plans through a full cycle. In our current geopolitical world, both are a wining strategy. Energy Security Starts at home is no longer a cool podcast line I use. But Energy Dominance is displayed through your exports, is critical to protecting the US Dollar and our trading advantages. So both of these things can be true, and are interdependent.
Appendix A | Full chart data and matching bases
Access date for all sources: November 7, 2026 CST. No future-date verification is implied. Financial figures below use Q3 2026 unless specifically stated. Links resolve to primary company records, not ENB estimates.
| Metric / unit | ExxonMobil | Chevron | Basis / warning |
| Operating cash flow (GAAP), $bn | 25.650 | 16.014 | Consolidated; chart 1 |
| GAAP net earnings attributable, $bn | 15.413 | 9.924 | Not basin profit |
| Net oil-equivalent production, million/day | 4.496 | 3.980 | Company total, not crude alone |
| Free cash flow (non-GAAP), $bn | 19.109 | 12.003 | Different definitions; no ranking |
| Cash capex / capex, $bn | 7.002 | 4.011 | XOM non-GAAP cash capex; CVX capex; affiliate treatment differs |
| Net debt, $bn at Sept. 30 | 22.100 | 20.730 | Company definitions; not debt capacity ranking |
Primary tables: ExxonMobil results and Chevron results. CFFO chart uses only GAAP operating cash; cash capex is not charted as a standardized comparison.
| Disclosure | Value | Period / caveat |
| Exxon Permian Q3 2026 | 1.8 million boe/d | Rounded actual; deck slide 24 |
| Exxon Permian FY2026 | ~1.8 million boe/d | Annual plan, not Q3 annualization |
| Exxon Permian 2030 | ~2.5 million boe/d | Plan; ~0.7 increase / 1.8 ≈39% |
| Chevron Permian | Above 1 million boe/d | Six quarters; call does not supply exact rate used here |
| Chevron plateau horizon | End of next decade and potentially beyond | Management outlook, not guaranteed output |
| Chevron Venezuela 2031 | ~600,000 barrels of oil/day gross | JV forecast, not Chevron net; not boe |
Primary sources: ExxonMobil slide 24, Chevron call and Chevron presentation. Exxon 2030 Permian/total plan = 2.5/5.5 ≈45%, a planning ratio, not current oil share. No extrapolated Chevron ratio is calculated.
Appendix B | Conditional scenario scorecard
ENB analysis. No modeled segment cash flows, target share prices or probabilities. Price levels are illustrative assumptions, not forecasts. “Wins” means the stated operating objective, not the highest future stock return.
| Scenario | Assumptions / horizon | Conditional assessment |
| Lower-price stress | Illustrative $50 Brent; gas/margins unchanged, 1–2 years | Cash protection and capital flexibility matter. Chevron plateau may help; Exxon efficiencies may offset. No proven dollar winner. |
| Planning environment | Illustrative $70 Brent; stable terms; through 2030 | Chevron deck uses $70 flat Brent for Venezuela economics. Both compete on returns; no comparable basin cash curve disclosed. |
| Strong-price development | Illustrative $100 Brent; infrastructure available; through 2030 | Exxon has greater stated Permian volume upside if ~2.5m delivered efficiently. More volume is not assured higher shareholder return. |
| Execution / country stress | Any oil price; delayed technology or adverse fiscal terms | Exxon recovery/capital risk versus Chevron overseas terms and delivery risk. Both have international exposure; no categorical winner. |
Scorecard to monitor: actual net Permian volumes and oil mix; acquisition-inclusive returns; sustaining capital; incremental well recovery after enough production history; water/gas takeaway and power reliability; international fiscal and delivery milestones. Missing inputs prevent a numerical company ranking.
Appendix C | Methodology and background
- Facts were researched November 7, 2026 CST. Planned issue date is Sunday November 8; there is no claim of November 8 verification, no current stock quotation and no live oil-price assertion. October 30 releases and calls are the latest quarterly results located as of research. Q4 results have not been substituted or invented.
- Q3 means the three months ended September 30, 2026. All financial chart values use that quarter. Balance-sheet numbers are explicitly point-in-time. Annual plans, quarter actuals and multi-year outlooks remain separate. Company-reported net/attributable production is not gross project capacity; the Venezuela comparison is explicitly gross JV oil. boe converts energy, not economic value, and includes gas and liquids; oil-equivalent output is not a barrel of refined fuel.
- The production graphic deliberately uses two disclosure cards, not equal-length exact bars: Exxon provides a rounded quarterly Permian rate and 2030 plan; Chevron’s selected call disclosure gives a lower-bound plateau. We do not turn “above one million” into exactly one million or interpolate missing quarters. The Exxon 39% calculation uses rounded figures and is approximate, not a growth-rate forecast.
- Cash-flow chart data divide reported millions by 1,000: 25,650/1,000=25.650; 16,014/1,000=16.014. No company totals are apportioned to Permian. Exxon free cash flow sums operating cash flow, net cash flow used in investing activities excluding cash acquired from mergers and acquisitions, and inflows from noncontrolling interests for major projects from financing activities; Chevron FCF is CFFO less capex. Chevron adjusted FCF additionally adjusts working capital and adds proceeds/returns of investment and net affiliate-loan repayments. 16.014−4.011=12.003; 12.003+0.538+0.710+0.992=14.243.
- The scenario matrix is ENB qualitative analysis, not a valuation or production model. $50/$70/$100 Brent are deliberately chosen illustrative conditions, not forecasts or asserted observed prices. Only the $70 planning anchor is tied to Chevron’s deck. We hold gas prices, refining margins, tax regimes and capital efficiency notionally constant to isolate the direction of oil-price pressure; real-world variables will not remain fixed. There is no cash-flow calculation from these price levels, no probability weighting and no target share price.
- We do not convert Exxon’s corporate annual Brent sensitivity into a Permian sensitivity. A price change also alters entitlements, taxes, working capital, service inflation and downstream margins. A company with more barrels does not necessarily generate better returns after acquisition costs. This is editorial analysis, not personalized investment advice.
- Pioneer acquisition growth is not all organic. Exxon’s 2024 comparison contains acquisition timing, and its 2026 integration claims remain management estimates. Chevron acquired Hess July 18, 2025 (10-Q Note 18), adding Guyana, U.S. and Malaysian positions; nine-month year-on-year company growth therefore has acquisition scope effects. No organic-growth comparison is inferred from those totals.
- This analysis uses company-published transcripts and presentations, not original call audio. Chevron’s transcript is company-edited. Source excerpts are selected passages, not complete reproductions, and company outlooks have not been independently engineered or audited.
Appendix D | Linked sources and exact primary excerpts
All accessed November 7, 2026 CST. Excerpts are selected source passages, not complete reproductions. Company outlooks remain claims and estimates; source quotations are not independent engineering verification.
01. LinkedIn commentary, November 6, 2026
Excerpt: “Chevron Runs Permian for Cash, Exxon Bets the House”
LinkedIn displays this November 6 commentary under Oberon Houston’s byline. Its interpretations and reader comments are not primary evidence of company economics. The displayed byline does not independently authenticate identity or biography.
https://www.linkedin.com/pulse/chevron-runs-permian-cash-exxon-bets-house-oberon-houston-5ibwe/
02. ExxonMobil Q3 release, October 30, 2026
Excerpt: “Cash flow from operating activities was $25.7 billion and free cash flow was $19.1 billion.”
Primary results tables provide unrounded $25,650m and $19,109m; GAAP earnings $15,413m; worldwide production 4,496 koebd.
03. Chevron Q3 release, October 30, 2026
Excerpt: “Capex in the third quarter of 2026 was lower than last year largely due to lower spend in the Permian Basin.”
Primary release and attachments: CFFO $16,014m; capex $4,011m; FCF $12,003m; adjusted FCF $14,243m.
04. ExxonMobil Q3 presentation, October 30, 2026
Excerpt: “Investment returns exclude prior exploration and acquisition costs.”
Slide 24 has 1.8 quarterly actual, ~1.8 FY2026 plan and ~2.5 2030 plan in Moebd. Definition near investment returns explains exclusion.
05. Chevron company-edited Q3 call, October 30, 2026
Excerpt: “we continue to focus on maximizing free cash flow there.”
Nelson on Permian. Also sixth consecutive quarter above one million boe/d; Wirth long plateau outlook; D&C down 40%, facilities down 50%, capex/oil barrel >25% improvement; baselines not rebuilt. Company-edited transcript, not original audio.
https://chevroncorp.gcs-web.com/static-files/000e7741-422d-4e9f-854e-07c4ccee0ffb
06. Chevron Q3 presentation, October 30, 2026
Excerpt: “~600 MBOD gross expected by 2031”
Venezuela slide 4, JV figures; illustrative economics at $70 flat Brent. Financial slides and notes define organic capex, FCF and adjusted FCF. Source excerpts are selected passages.
https://chevroncorp.gcs-web.com/static-files/0d6c93e3-60f4-4274-bf1d-f564503f034d
07. ExxonMobil company-hosted Q3 transcript, October 30, 2026
Excerpt: “We have three in operation today.”
Permian automated rigs: about 25% of fleet next year and half by 2028. CFO describes Pioneer synergies from $2bn to $4bn/year; treat as management integration estimate.
08. ExxonMobil plan prepared remarks, December 9, 2025
Excerpt: “10% return for the full life of the asset.”
Permian discussion PDF printed p24: roughly $30/bbl cost of supply and 2.5m boe/d target. Historical plan context, not a new November announcement.
09. ExxonMobil September 30, 2026 Form 10-Q
Excerpt: “For the quarterly period ended September 30, 2026”
Company-hosted filing. Results and risk context; no standalone audited Permian cash-flow assertion. Primary interim statements are not a separate basin audit.
10. Chevron September 30, 2026 Form 10-Q
Excerpt: “On July 18, 2025, the company acquired Hess Corporation”
SEC primary Note 18; Note 19 proposed midstream restructuring subject to closing. Q3 attributable earnings $9,924m; nine-month CFFO $41,161m. Selected excerpts, not a complete reproduction.
https://www.sec.gov/Archives/edgar/data/93410/000009341026000200/cvx-20260930.htm
11. Chevron filing index, filed November 5, 2026
Excerpt: “Document Date Sep 30, 2026”
Index confirms filing/period, not the complete filing text. See the actual SEC filing separately listed above.
https://chevroncorp.gcs-web.com/sec-filings/sec-filing/10-q/0000093410-26-000200
Appendix E | Material gaps and publication guardrails
- Comparable standalone Permian operating cash flow, free cash flow, sustaining capital, full acquisition-inclusive breakeven and after-tax project returns are not established. There is no defensible numerical stock winner or basin-cash ranking.
- A matched current pair of Permian rig counts, completion crews, well counts, lateral lengths, oil/gas mix and realized prices was not established. Exxon’s automation percentage is not an absolute fleet plan. Chevron’s Bakken rig guidance is a different basin and is not relabeled Permian.
- Chevron’s percentage cost/spending improvements lack fully reconstructable common baselines in the selected call. They remain attributed, not independently benchmarked efficiency results. No broad geological decline or basin inventory forecast is adopted from the commentary.
- The commentary’s $3.5 billion Permian spending estimate, royalty percentage, industry inventory counts, Dallas Fed survey numbers, gas-oil-ratio series and water-cost projections were not independently cleared for use here. They do not enter charts or scenario arithmetic. The author’s inference that Chevron is waiting for an acquisition is not a disclosed company plan.
- LinkedIn displays this November 6 commentary under Oberon Houston’s byline. Its interpretations and reader comments are not primary evidence of company economics. The displayed byline does not independently authenticate the author’s identity or biography.
- No household fuel-price saving, global price forecast, country-event forecast or guaranteed technology recovery gain can be calculated from these sources. Permian production guidance and Venezuela growth remain forward-looking. Review announcements immediately before Stu publishes if he chooses to do so.
The post Exxon Wants More Permian Barrels. Chevron Wants More Cash. Families and Investors Need Both to Deliver. appeared first on Energy News Beat.