Energy Security Starts at Home, and Energy Dominance is Displayed through your exports. Well, the US is clearly energy dominant until you hit California, and then they are 80% dependent on foreign energy.
1. Global Energy Crisis & Iran War Impact
The Podcast opens with the Iran war creating a severe global energy crisis. Key impacts include:
- Europe lost 75% of fuel supplies, causing flight cancellations during peak tourism
- Asia down to 30 days of jet fuel; Pakistan implementing mandatory 4-day work weeks
- India is restricting cremations due to gas shortages; Egypt is imposing 9 PM curfews
- Bangladesh is experiencing violent fuel shortages
- 1 billion barrels of oil removed from the market, with strategic reserves only offsetting half the loss
2. U.S. Energy Dominance & California’s Vulnerability
- America is positioned as the “world’s emergency gas station” with ramped-up oil production
- California facing a critical local energy crunch due to refinery closures (Phillips 66 LA, Valero Valencia reducing capacity by ~20%)
- Warning that tanker imports will dry up in weeks; urgent call for federal intervention to keep refineries operational
3. Pipeline Infrastructure & Energy Independence
- Keystone XL Revival: Trump administration signing orders for the Bridger Pipeline Expansion (650 miles from Montana to Wyoming), leveraging existing infrastructure
- Trans-Caspian Pipeline: Turkey positioning itself as a geopolitical player in European energy independence from Russian gas
- Emphasis on energy security, starting at home, and energy dominance through exports
4. Corporate Strategy: Oil Companies & Venezuela
- Chevron is maintaining its foothold in Venezuela while ExxonMobil and ConocoPhillips are re-entering after nearly two decades
- Venezuela holds the world’s largest proven oil reserves but with challenges in extraction
5. Energy Transition Sustainability Crisis
- $10 trillion spent on wind, solar, and hydrogen, yielding only 3% additional energy globally
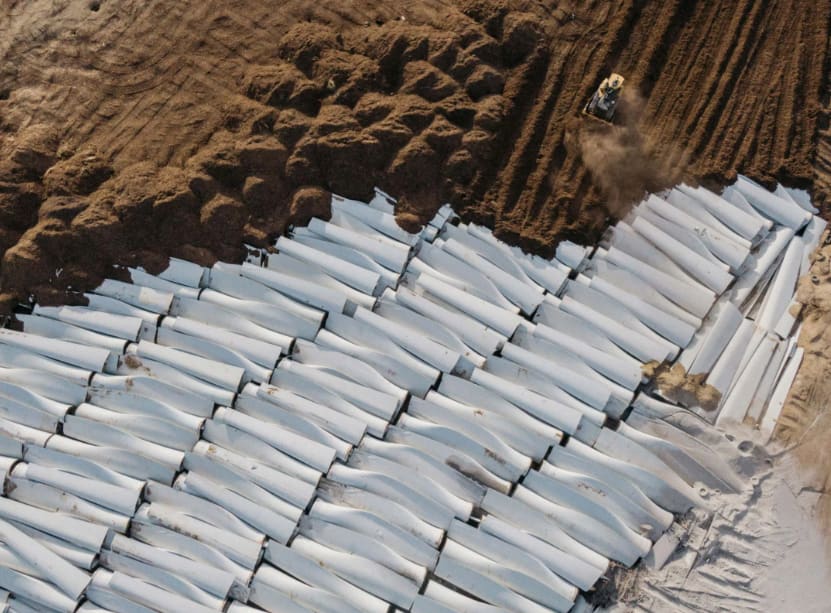
- 225,000 turbines worldwide requiring decommissioning before 2050—creating a “replacement treadmill.”
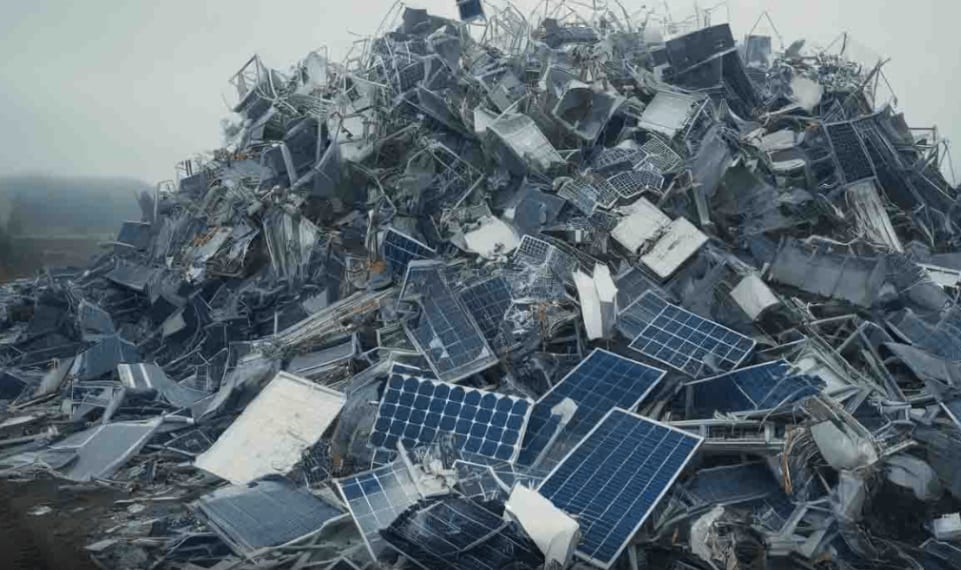
- Solar panels: 95% not recycled in the U.S., ending up in landfills
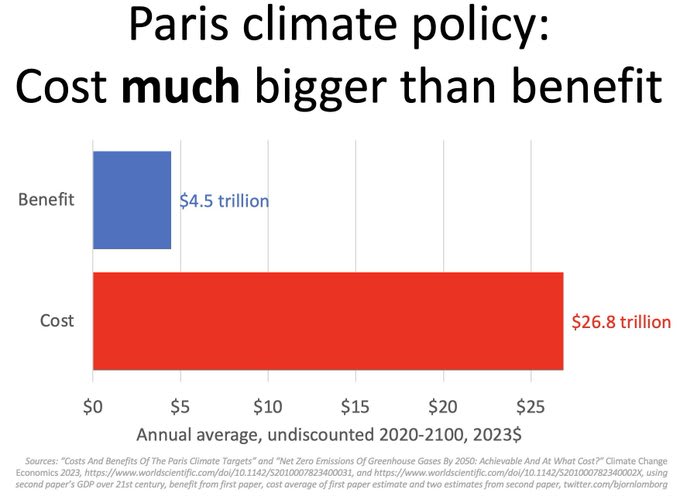
- Paris Climate Accord cost $26.8 trillion for $4.5 trillion in benefits—math doesn’t add up
6. U.S. Hydroelectricity Crisis
- Worst drought in 1,200 years threatens western power generation
- Hoover Dam approaching “Deadpool” levels (below electricity generation capacity)
- Federal intervention with supplemental releases from Flaming Gorge Reservoir through 2027
7. Major Oil Company Earnings Reports
- Phillips 66: Beat Q1 earnings by 88 cents per share; strong refining margins
- Chevron: Largest earnings beat since October 2020 ($1.41 vs. $0.92-0.97 expected); CEO emphasizes operational fundamentals over headline profits
- ExxonMobil: Resilient Q1 performance with $9.2 billion in shareholder distributions
- Cheniere Energy (LNG): Strong position to sell all production at premium prices
8. Geopolitical & Financial Implications
- UAE leaving OPEC (producing 3.5M barrels/day), signaling shift from cartel to open market
- Discussion of U.S. financial control over Iraq and Venezuela’s oil supplies
- Concerns about silver market manipulation amid AI data center demand
- Paper vs. physical oil pricing divergence (physical trading at $140-160+ vs. paper at ~$101-108)
Overall Theme: Podcast presents a complex picture of global energy instability driven by geopolitical conflict, infrastructure challenges, and the limitations of renewable energy transitions—positioning U.S. energy dominance as critical to global stability.
Energy Security Starts at Home, but your Energy Dominance is displayed through your Exports.
The United States is Energy Independent, with the Exception of California. California is Energy Dependent.

Watch this video on YouTube.
1.Iran War Has Brought Energy Crisis to the Global Stage
This is HUGE!
Project Details: Route, Capacity, and Keystone XL Revival
The Bridger Pipeline Expansion (also referred to in filings as a 36-inch diameter crude oil transmission line) will stretch approximately 650 miles (about 1,050 km) from the U.S.-Canada border in Phillips County, Montana, through eastern Montana and into Wyoming, terminating at the major crude oil hub in Guernsey, Wyoming. From Guernsey, oil can connect to existing pipeline networks for further transport to refining centers such as Cushing, Oklahoma, or the U.S. Gulf Coast.
Key capacity figures include:
Initial operating capacity: Approximately 550,000 barrels per day (bpd) of Canadian crude oil and petroleum products.
Ultimate expandable capacity: Up to 1.13 million bpd.
The project is seeking firm commitments from shippers for around 450,000 bpd.
This represents roughly two-thirds of the original Keystone XL’s planned capacity (which was approximately 830,000 bpd). If fully realized, the pipeline could increase Canada’s crude exports to the U.S. by more than 12%.
Importantly, the project leverages existing Keystone XL infrastructure on the Canadian side. Approximately 150 km (93 miles) of pipe was already built and remains idle in Canada following the project’s cancellation by the Biden administration in 2021. The Canadian segment is fully permitted, and the new U.S. route differs from the original KXL path but originates near the same border crossing area.
The estimated cost for the U.S. portion is around $2 billion. Additional state regulatory permits are still required, and construction could begin as early as 2027, with potential operations starting around 2029.
Companies Involved (Opportunities for Investors)Canadian Side: South Bow Corp. (TSX/NYSE: SOBO), a pure-play liquids pipeline company spun off from TC Energy in October 2024. South Bow owns and operates the Keystone Pipeline System and holds the idle Canadian KXL assets. It is publicly traded and focused on connecting Alberta oil sands to U.S. markets. Investors can follow SOBO for exposure to this midstream growth.
4.Trans-Caspian Pipeline May Be a New Geopolitical Influencer
This will be one to watch – Geopolitical issues abound.
5.The Energy Transition Replacement Treadmill is Unsustainable
For two decades, governments, corporations, and activists have poured trillions into wind, solar, batteries, and hydrogen as the path to a “clean” energy future. The result? According to U.S. Energy Secretary Chris Wright, the world has spent roughly $10 trillion—yet wind and solar deliver only about 3% of global primary energy consumption. And nobody is talking about the $89 Billion dollar liabilty that we have for land reclamation for wind farms in the United States. None of them is funded.
That’s not a rounding error. It’s a stark illustration of the Energy Transition Replacement Treadmill—an endless, resource-intensive cycle of build, subsidize, degrade, replace, and landfill that shows no signs of slowing. As highlighted in a recent analysis by Peter Clack (@PeterDClack on X), we aren’t simply adding new capacity; we’re committing to repeated, massive replacements of today’s infrastructure long before 2050 net-zero targets.
The $10 Trillion for 3% Reality Check
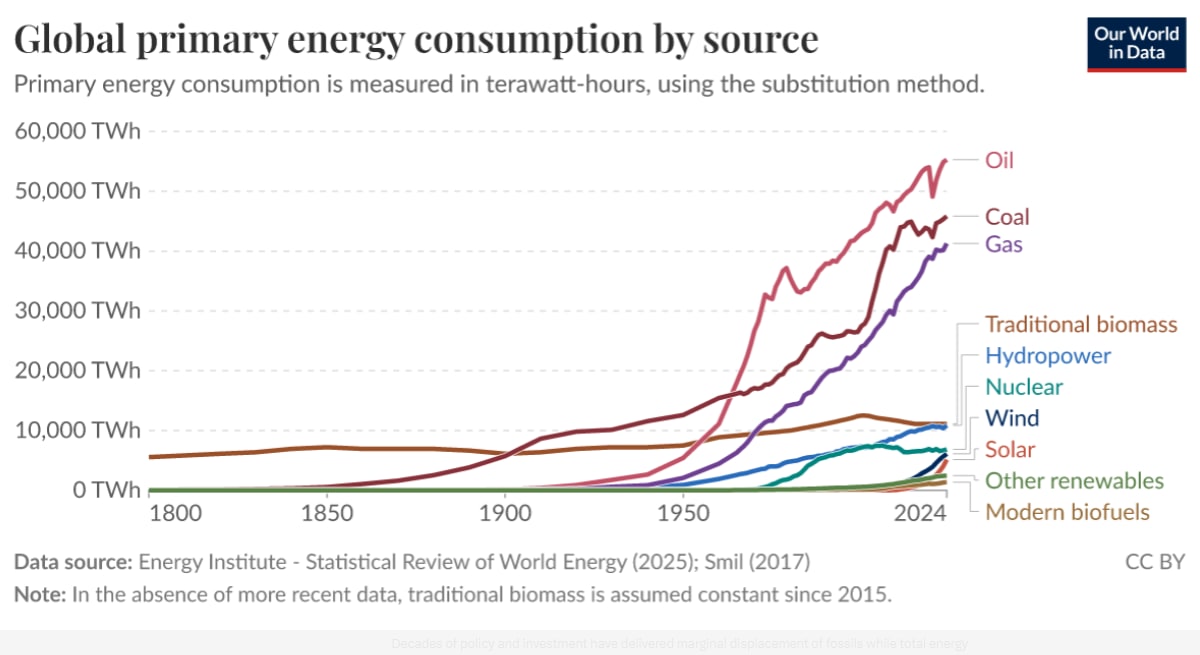
Global primary energy data confirms the minimal impact. In 2024, oil, gas, and coal still dominate ~80-86% of primary energy supply, with wind and solar contributing roughly 3% despite explosive capacity growth in electricity markets.
Renewables (including hydro and bio) are higher in electricity (~30-46% projected by 2030 in IEA outlooks), but primary energy—accounting for all uses like transport and heat—tells the true story. Decades of policy and investment have delivered marginal displacement of fossils while total energy demand keeps rising.
The Replacement Treadmill: Not One Transition, But Perpetual Cycles
Every wind turbine and solar panel installed today has a finite life: turbines ~20-30 years, panels ~25-35 years. Peter Clack notes that all ~225,000 turbines worldwide (>1.2 TW) will need decommissioning or repowering before 2050. The same applies to solar.
McKinsey estimates the baseline energy transition requires $9.2 trillion per year, totaling $275 trillion by 2050—figures that exclude the full cost of repeated replacements.
This is the treadmill: build once, pay again (and again) for the next generation.
The following chart, we feel, is slightly mis-calculated, and the $26.8 trillion figure is too low.
Grid Costs: The More Renewables, the More Expensive
Intermittency isn’t free. Higher wind/solar penetration drives up system costs for backup, transmission, and balancing. Real-world evidence shows a clear pattern: Germany’s electricity prices rose over 56% as renewables expanded to ~30% of electricity.
U.S. states with aggressive Renewable Portfolio Standards (RPS) saw prices 11-17% higher after 12 years.
Broader OECD analysis links rising renewable shares to higher retail electricity prices.
Studies confirm the correlation: variable renewables suppress wholesale prices in the short term (merit-order effect) but inflate total system costs through grid upgrades, storage, and firming capacity. Places like California and parts of Europe bear some of the world’s highest electricity rates alongside high renewable penetration.
Resources and Manufacturing: Finite Supply Meets Infinite Demand
Modern turbines demand massive inputs: steel, concrete, copper wiring, and rare-earth magnets (0.5–2 tonnes per MW for permanent-magnet designs). China controls ~90% of rare-earth refining. Solar requires aluminum frames, glass, silicon, silver, and copper. Scaling this globally competes for the same materials needed elsewhere in the economy.
Even “green” supply chains rely on fossil-powered mining and manufacturing—often in China, which burns coal to produce the panels and turbines sold to the West.
End-of-Life: The Recycling Myth and Landfill Reality
The treadmill’s back end is ugly. In the United States, recycling infrastructure is minimal: ~90% of end-of-life solar panels go to landfills because disposal is cheaper than recycling.
Wind turbine blades (composite fiberglass/epoxy, often airplane-wing sized) are overwhelmingly landfilled. NREL projects 2.2 million metric tons of U.S. blade waste by 2050; globally, 43 million tonnes of blade waste and 60–80 million tonnes of solar PV waste are expected.
Decades of Rising Costs, Minimal Environmental Gain
After trillions spent, fossil fuels still supply the vast majority of primary energy. Emissions reductions have been modest relative to investment, while wildlife impacts (bird/bat deaths), land use, and mining footprints mount. The “diesel paradox” persists: heavy equipment for mining and installation still runs on the very fuels the transition claims to replace.
Conclusion: Unsustainable by Design
The Energy Transition Replacement Treadmill is not a one-time investment—it’s a perpetual, escalating cycle of subsidies, resource extraction, grid overhauls, and waste. With $10 trillion already spent for a 3% primary-energy gain, and the first wave of replacements now approaching, the math no longer adds up. True sustainability requires reliable, dispatchable, affordable energy—not an endless loop of replacement and regret.
Policymakers and investors must confront physical realities: finite resources, engineering limits, and economic trade-offs. The treadmill isn’t just expensive—it’s unsustainable.
6.US Hydroelectricity in Crisis: The Worst Drought in 1,200 Years Threatens Western Power Generation
Timeline to “Dead Pool” and Interventions
Federal officials are acting aggressively to avert catastrophe under the Drought Response Operations Agreement:
Supplemental releases of 660,000–1 million acre-feet from Flaming Gorge Reservoir (upstream on the Green River) through April 2027.
Reduced annual releases from Lake Powell to Lake Mead by ~1.48 million acre-feet.
These measures are projected to raise Lake Powell by ~54 feet, keeping it above 3,500 feet (and minimum power pool) through at least April 2027.
Without these steps, the minimum power pool at Glen Canyon will be available as soon as this fall (2026); there is a dead pool risk within 1–2 years if the megadrought persists. Even with interventions, Lake Mead will drop faster, accelerating Hoover Dam’s power reductions.
Longer-term outlook remains grim. The megadrought, exacerbated by climate change, overuse, and overallocation under the 1922 Colorado River Compact, shows no quick end. Snowpack and inflows for Water Year 2026 are among the lowest on record (e.g., Powell unregulated inflow forecast as low as 35% of normal).
What This Means for Energy
This is not just a water crisis—it is an energy security issue. Hydropower provides flexible, renewable baseload and peaking power. Losing Glen Canyon and Hoover output would increase reliance on natural gas or other sources, raising costs and emissions while straining Western grids already facing growing demand (e.g., data centers, electrification).
The viral X post and video capture public anxiety, but the data show a managed (for now) emergency. Sustained conservation, better interstate agreements, and long-term solutions (e.g., demand reduction, infrastructure upgrades) are essential to prevent the worst-case “dead pool” scenario from becoming reality. Keep watching to see if progress is made, and whether this is a man-made crisis is a really good question.
If you want more on the earnings, check out all the details here:
7.Phillips 66 Beats Q1 Estimates by $.88 Per Share as Refining Margins Surge


A shout-out to Steve Reese and the Reese Energy Consulting group for sponsoring the Podcast https://reeseenergyconsulting.com/.

Data2 if you have any business systems, can you trust A? Well, they have the patent on validation. . https://data2.zoholandingpage.com/energy
And we have WellDatabase rolling in as a new sponsor.
The post Iran War has Brought The Energy Crisis to the Center Stage. We also cover the Energy Transition, Exxon and Chevron Earnings. appeared first on Energy News Beat.