
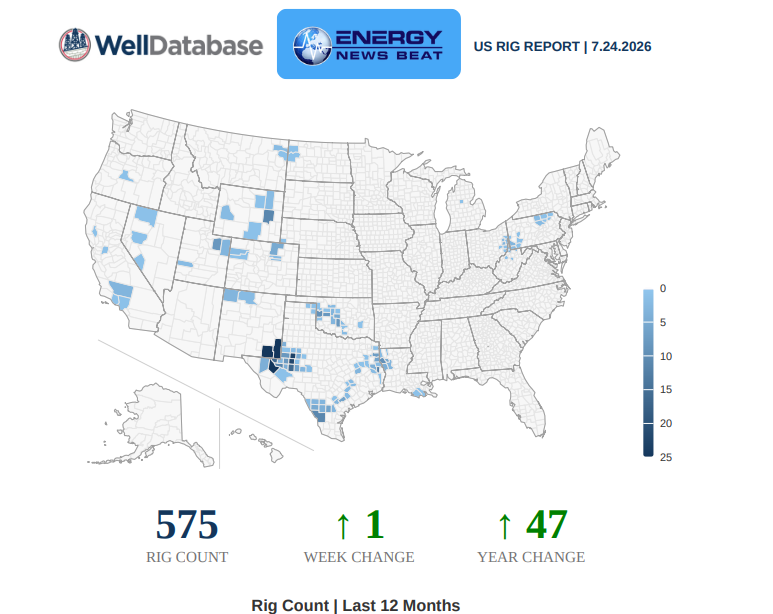
U.S. drilling activity showed mixed signals this week as different rig count providers reported divergent weekly moves against a backdrop of solid year-over-year gains. The latest WellDatabase US Rig Report (dated July 24, 2026) puts the active U.S. rig count at 575, up 1 from the prior week and up 47 from a year earlier.
Baker Hughes, whose weekly rotary rig census is the long-standing industry benchmark, reported 587 U.S. rigs for the week of July 24, 2026—a decline of 1 from the 588 recorded on July 17 and an increase of 45 from the year-ago level. The prior Baker Hughes week (July 17) had shown a strong +7 gain to 588, with oil-directed rigs rising 7 to 452, gas steady at 126, and miscellaneous at 10.
Enverus, which tracks a broader portion of the fleet daily primarily via GPS, typically reports higher totals than Baker Hughes (often in the 620–630+ range in recent mid-2026 periods). Public daily figures are platform-restricted, but the methodological difference—GPS-based real-time visibility versus Baker Hughes’ weekly rotary census—explains why Enverus numbers run higher while still reflecting the same underlying trends of resilient but not accelerating activity.
These mixed weekly totals (WellDatabase +1, Baker Hughes –1) after several weeks of net gains point to a potential slowing or plateau in the pace of active-rig additions, even as the industry remains well above year-ago levels. We use WellDatabase on a daily basis and highly recommend their numbers.
This week’s report is linked in a PDF for you to download, and we also recommend you get your own account!
Operator Activity
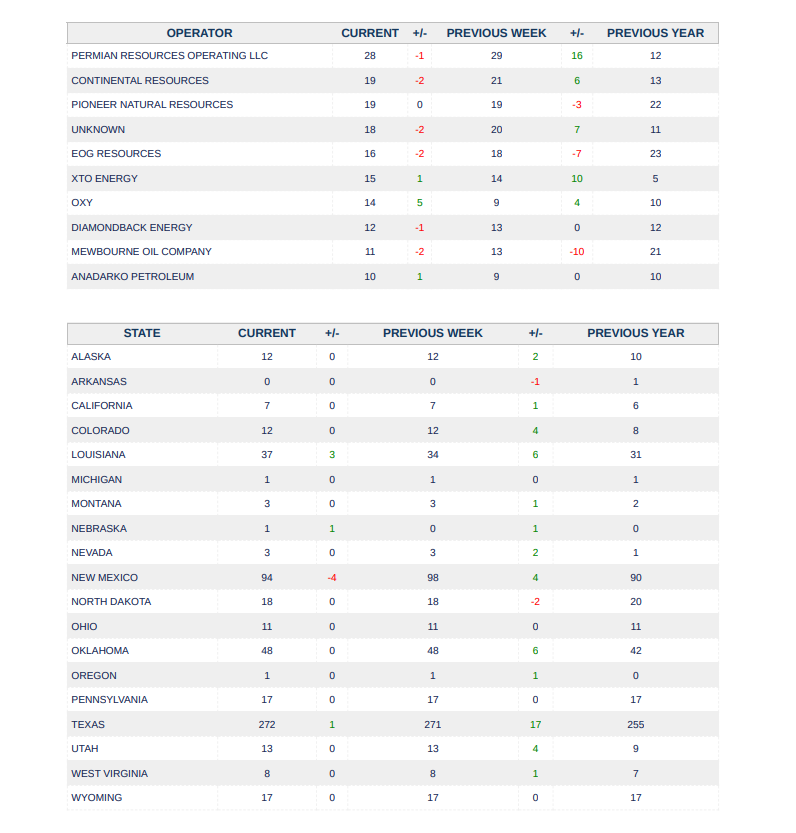
WellDatabase’s operator ranking highlights concentration among large Permian-focused players, with some notable weekly shifts:
- Permian Resources Operating LLC: 28 (–1 week, +16 year)
- Continental Resources: 19 (–2 week, +6 year)
- Pioneer Natural Resources: 19 (flat week, –3 year)
- Unknown: 18 (–2 week, +7 year)
- EOG Resources: 16 (–2 week, –7 year)
- XTO Energy: 15 (+1 week, +10 year)
- OXY: 14 (+5 week, +4 year)
- Diamondback Energy: 12 (–1 week, flat year)
- Mewbourne Oil Company: 11 (–2 week, –10 year)
- Anadarko Petroleum: 10 (+1 week, flat year)
OXY’s sharp weekly gain stood out amid otherwise modest or negative moves among the top 10, underscoring selective capital allocation rather than broad fleet expansion.
State and Basin Trends
Texas continues to dominate with 272 rigs (+1 week, +17 year). New Mexico eased to 94 (–4 week, +4 year), while Louisiana rose to 37 (+3 week, +6 year). Oklahoma held steady at 48 (+6 year), North Dakota at 18, Pennsylvania at 17, and Wyoming at 17. Smaller gains appeared in Nebraska (+1 to 1).
Basin data reinforces Permian leadership even as it pulled back: Permian at 256 (–5 week, –9 year), followed by “Other” at 108 (+2 week, +24 year), Haynesville at 55 (flat week, +17 year), Eagle Ford at 47 (+3 week, +6 year), Williston at 21 (flat, –1 year), Cana Woodford at 20, Marcellus at 24, and Utica at 12. The Permian still accounts for nearly half of active U.S. activity, but the weekly decline there, combined with gains in Eagle Ford and “Other,” contributes to the mixed overall picture.
Well Type, Orientation, and Depth
Oil-directed rigs remained the clear majority at 421 (flat week, +24 year), with gas at 126 (flat, +19 year) and thermal at 9. Horizontal wells continue to dominate at 493 (–3 week, +24 year), directional at 48 (flat, +6 year), and vertical at 31 (+1 week, +14 year).
Depth ranges show the bulk of activity in the 10k–15k ft interval (258, +3 week, +31 year), followed by 5k–10k ft (109, –7 week), >20k ft (102, +3 week), and 15k–20k ft (73, flat).
The 12-month WellDatabase chart shows a gradual upward drift from the mid-500s range into the current 575 level, consistent with the year-over-year gains reported across providers.
Oil Storage Context
U.S. commercial crude oil inventories (excluding the Strategic Petroleum Reserve) rose 2.0 million barrels in the week ending July 17, 2026, to 411.7 million barrels—approximately 6% below the five-year average for this time of year. Refinery inputs averaged 17.1 million b/d, and the modest build comes amid ongoing discussions of global inventory draws earlier in the year and seasonal demand patterns. The next EIA Weekly Petroleum Status Report (covering the week ending July 24) is due July 29.
Outlook
The mixed weekly signals—WellDatabase’s modest gain versus Baker Hughes’ small decline—suggest the multi-week addition streak may be moderating. Operators appear selective, prioritizing efficiency and high-return acreage (especially in the Permian and select gas plays) rather than aggressive fleet growth. Year-over-year increases of roughly 45–47 rigs across major counts still indicate a healthier activity base than in mid-2025, supported by oil-directed and horizontal drilling. Continued monitoring of operator capital budgets, commodity prices, and the next set of weekly counts will clarify whether this is a temporary pause or the start of a slower phase.
Appendix: Sources and Links
- WellDatabase US Rig Report | 7.24.2026 (attached report with map, 12-month charts, operator/state/basin/well-type tables)
- Baker Hughes Rig Count Overview: https://rigcount.bakerhughes.com/
- Baker Hughes North America data and historical tables: https://www.aogr.com/web-exclusives/us-rig-count
- Enverus U.S. Daily Rig Count: https://www.enverus.com/dailyrigcount/
- EIA Weekly Petroleum Status Report (week ending July 17, 2026; released July 22): https://www.eia.gov/petroleum/supply/weekly/ and summary PDF https://ir.eia.gov/wpsr/wpsrsummary.pdf
- Prior Energy News Beat WellDatabase coverage (July 18, 2026 report for methodological context): https://energynewsbeat.co/big-oil-companies/welldatabase-weekly-rig-report-for-july-18-2026-us-rig-count-climbs-up-11-with-strong-horizontal-and-oil-activity/
- Additional Baker Hughes week-ending references via Reuters, Trading Economics, and Investing.com economic calendars for cross-verification of July 17 and July 24 totals.
The post Mixed Rig Totals Signal Slowing on Active Rigs appeared first on Energy News Beat.