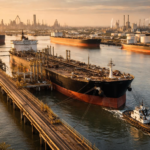

On March 17, 2026, the Department of Homeland Security issued the longest and broadest Jones Act waiver since at least 1950, covering energy commodities and fertilizer inputs. The waiver was extended twice and now runs through November 15, 2026, with a narrower product list and voyage-by-voyage review after August 17.
The Cato Institute’s Jones Act Waiver Tracker, built from Maritime Administration (MARAD) voyage reports, is the primary public ledger of that experiment. As of mid-September 2026, it showed roughly 67.7 million barrels moved as a floor—not a complete total—across crude, gasoline, diesel, jet fuel, propane, ammonia, renewable fuels, and other products. Early snapshots already showed more gasoline and jet fuel from the Gulf Coast to the West Coast in 70 days than in all of 2020–2025 combined.
Colin Grabow of the Cato Institute walked through the same data on the Energy News Beat podcast with Stu Turley and David Blackmon: in a matter of months, more energy moved on domestic water routes than in any single year in the prior quarter century. That conversation is the natural companion to this article.
What the numbers show
Reported waiver cargo (mid-September 2026, MARAD-based floor):
- Crude oil: about 21.7 million barrels
- Gasoline: about 18.2 million barrels
- Diesel/ULSD, jet fuel, naphtha, VGO, fuel oil, renewable fuels, propane, ammonia, and other products making up the balance
- Total: ~67.7 million barrels
Major new or revived flows:
- Gulf Coast to West Coast (PADD 5): tens of millions of barrels of fuels that barely moved by water in prior years
- Gulf Coast to Puerto Rico: propane and other products after years of near-zero bulk U.S. LPG because there are no Jones Act LPG tankers
- Gulf Coast crude to East Coast refineries, including Pennsylvania
- Fertilizer/ammonia movements that would otherwise have been constrained
Cato’s tracker and related writing emphasize that these voyages sat on top of normal Jones Act traffic. The Jones Act tanker fleet—56 oceangoing tankers in current trackers—has been fully employed: underway, in port working cargo, in scheduled drydock, or on military charter. Independent tanker employment trackers show the same picture through late September 2026: zero idle Jones Act tankers. Foreign-flag ships filled demand the U.S. coastwise fleet could not meet.
Jones Act-eligible oceangoing vessels of 1,000 gross tons and above number about 92–93 in recent MARAD inventories. The broader U.S.-flag ocean fleet is about 190 ships. The global commercial seagoing fleet is on the order of 62,000 vessels. The United States is a rounding error in commercial shipbuilding output.
How much did consumers save?
The cleanest published freight-savings estimate comes from the American Action Forum (September 2026). Using observed volumes in the first 160 days and scaling across the March–November waiver window, AAF estimated $99.9 million to $110.1 million in avoided waterborne freight penalties:
- Gulf–West Coast: ~$2.8 per barrel (~6.6 cents per gallon)
- Gulf–East Coast: ~$0.63–$0.82 per barrel on products
- Gulf–Puerto Rico: ~$1.8–$2.3 per barrel
That is real money for refiners, wholesalers, Puerto Rico, and West Coast buyers. It is not a national pump-price revolution. Waiver gasoline volumes were small next to U.S. consumption of roughly 8.7–9 million barrels per day. Energy Secretary Chris Wright has said the waiver helped California and East Coast supplies; retail prices stayed high because the dominant shock was the Iran war and a constrained Strait of Hormuz, not cabotage rules alone.
Pro-Jones Act groups, notably the American Maritime Partnership, argue the opposite on the early waiver period: many U.S. vessels were available, foreign rates were not always cheaper in a tight global tanker market, pump prices did not fall in a statistically clean way, and U.S. product exports continued. Those critiques belong in the record. They do not erase the volume surge on routes that historically had almost no waterborne Gulf-to-West-Coast clean-product trade, or the first bulk U.S. propane liftings into Puerto Rico.
Bottom line on “how much Trump saved consumers”: documented freight savings on the order of $100 million-plus through November, plus unquantified but material avoided shortage costs in California, Puerto Rico, and parts of the East Coast. The consumer benefit is regional and logistical first, national average-price second.
If those shipments had not existed
Treat the waiver volumes as revealed demand the Jones Act fleet could not serve.
Without foreign-flag lift:
- California would have leaned harder on rail, inventories, and foreign barrels while local refining was already under stress.
- Puerto Rico would have stayed locked out of bulk U.S. propane.
- East Coast refiners would have had fewer waterborne options from Texas and the Bakken.
- Farmers would have had less timely ammonia.
- Some cargo would have gone abroad instead of to U.S. ports, or not moved at all.
The “huge negative impact” is not a single GDP multiplier you can print to the dollar. It is higher regional fuel and fertilizer prices, thinner inventories during a global oil shock, and the familiar Jones Act pattern: American molecules that cannot cheaply reach American customers by water. Cato’s historical comparisons show waiver flows running well above prior-year waterborne trends on the West Coast and Puerto Rico. That gap is the suppressed market.
Missing reports and companies not following the rules
Official MARAD totals are a floor. Bloomberg and follow-on work by Grabow using AIS, draft changes, and ballast data identified additional foreign-flag coastwise movements that never appeared in the public voyage reports.
Grabow’s September analysis pointed to about 14 tanker voyages with strong load-and-discharge signatures plus a possible 15th LPG movement—on the order of 5 million barrels of capacity, not necessarily full cargo. Routes included California, Puerto Rico, Hawaii, Marcus Hook, and New Haven. Operators are required to report completed waiver voyages to MARAD within 10 days. MARAD has said it lacks strong tools to compel filings. American Maritime Partnership called the gaps “outrageous.” That is a compliance and transparency failure, not proof the cargo did not move. It means published savings and volume figures understate activity.
After August 17, the process tightened: vessel-availability requests, MARAD market surveys, and Department of War determinations before a foreign ship sails. That should improve the paper trail. It does not rewrite the first five months of incomplete reporting.
U.S. ships versus the world
|
Fleet
|
Approximate size (2026)
|
|---|---|
|
Jones Act–eligible oceangoing (1,000 GT+)
|
~92–93
|
|
Of which tankers (coastwise energy workhorses)
|
~56, fully employed
|
|
Total U.S.-flag ocean merchant ships
|
~188–190
|
|
Global commercial seagoing fleet
|
~62,000
|
|
U.S. share of global commercial shipbuilding
|
~0.03–0.1%
|
The Jones Act ocean fleet has collapsed from hundreds of ships in the mid-20th century and 257 in 1980-era comparisons used on the Energy News Beat podcast to the low 90s today. U.S. yards deliver a handful of large commercial ships per year. China, Korea, and Japan build the world’s fleet.
That is the industrial reality the waiver exposed: when energy had to move, America rented the global tanker market because it does not own enough compliant hulls.
How to get U.S. shipbuilding back—and whether to buy hulls or whole ships
No 12-month path recreates a Korean-scale commercial yard system. There is a sequence.
1. Do not pretend the current Jones Act build mandate rebuilt the industry. A century of captive demand produced fewer ships, older ships, and 4–5× capital costs (a U.S. containership or tanker often cited around $200–335 million versus ~$50–75 million for a foreign ship). Operators send U.S.-flag ships to Asian yards for repairs and life-extension because it is cheaper even after duties. Protection without productivity is how you get 92 ships and 0.03% of world output.
2. Fastest way to more U.S.-flag, U.S.-crewed capacity: buy ships. Used and new foreign-built vessels can be reflagged for international trade and sealift (MSP, Tanker Security Program, Ready Reserve). That grows mariners and hulls in years, not decades. It does little for construction jobs.
3. Best industrial-base compromise: allied green hulls and modules, finished in U.S. yards. Korea and Japan already know how to build tankers and boxships at cost. Import the steel hull and major blocks; do outfitting, systems, combat-useful features, and quality control in U.S. yards. That is how you train welders and expand throughput faster than “every plate cut in America.” Hanwha’s purchase of Philly Shipyard is the live version of importing methods, not just rhetoric. Full foreign construction of naval major hull components is legally constrained; commercial Jones Act reform is a policy choice.
4. Buying finished foreign ships only, while yards are “being built,” is a trap if the political goal is a durable industrial base. You get tonnage. You do not get serial production learning. Finishing hulls is the middle path that actually uses existing U.S. waterfront.
5. Reform the statute instead of only waiving it in crises. The highest-leverage change most market-oriented analysts (including Grabow on Energy News Beat) favor is ending or narrowly cabining the U.S.-build requirement while keeping U.S. flag, ownership, and crew for coastwise and security fleets—or limiting eligible foreign construction to allied yards.
Pair that with targeted yard modernization, Title XI-style finance, and a stipend fleet for international trades rather than a permanent 4–5× tax on every Hawaii, Puerto Rico, and Gulf-to-California barrel.Practical stack for 2026–2030:
- Keep emergency waiver authority honest and reported.
- Recapitalize the international U.S.-flag fleet with purchased and allied-built ships now.
- Convert 2–4 commercial yards into high-throughput finishing and module plants with Korean/Japanese partners.
- Use Jones Act reform or a second registry so those ships can work domestically without waiting 10 years for a $250 million U.S.-assembled tanker.
- Measure success by employed mariners, available deadweight, and delivery time—not by how strictly a 1920 build rule is enforced.
The 2026 waivers did not repeal the Jones Act. They showed what the law blocks: American energy moving on water to American customers when the 56 tankers are already busy. Freight savings of about $100 million are the easy number. The harder number is the capacity that still is not there when the next shock arrives.
Here is the interview with Colin Grabow, Cato Institute,
and David Blackmon, Forbes, Daily Caller, and Substack Author.

Making Appendices Great Again
Check out the World’s Greatest Podcast Show Notes at EnergyNewsBeat.co or EnergyNewsBeat.com.
Appendix: Sources and links
- Cato Institute Jones Act Waiver Tracker: https://www.cato.org/jones-act-waiver-tracker
- MARAD U.S.-flag fleet dashboard and inventories: https://www.maritime.dot.gov/data-reports/us-flag-fleet-dashboard
- Jones Act tanker employment tracker: https://jonesacttankertracker.com/
Savings and flow analysis
- American Action Forum, “The Jones Act Petroleum Waiver: Assessing Flows and Cost Savings”: https://www.americanactionforum.org/insight/the-jones-act-petroleum-waiver-assessing-flows-and-cost-savings/
- Cato, “The Jones Act Waiver Has Moved More Energy Than Official Numbers Show”: https://www.cato.org/blog/jones-act-waiver-has-moved-more-energy-official-numbers-show
- AP / Reuters / CNBC coverage of the March waiver and August extension
Unreported voyages
- gCaptain and Maritime Executive summaries of Bloomberg and Grabow AIS analysis (September 2026)
Energy News Beat / Colin Grabow
- “The Jones Act – Its Impact on Downstream with Colin Grabow, Cato Institute”: https://energynewsbeat.co/conversations-in-energy-with-stu-turley/the-jones-act-its-impact-on-downstream-with-colin-grabow-cato-institute/
- Jones Act tag archive: https://energynewsbeat.co/tag/jones-act/
Fleet and shipbuilding context
- U.S. Shipbuilding: The Record: https://usshipbuilding.org/
- New York Post on U.S. vs. China orderbooks (July 2026)
- Atlantic Council, “The US paper fleet: The Jones Act and the 2026 Iran war stress test”
- Balsa Research Jones Act Index: https://www.balsaresearch.com/jones-act-index
- American Maritime Partnership after-action report on the initial waiver period (counter-analysis)
Policy and industrial options
- Cato commentary on shipbuilding policy and buying vs. building
- Coverage of Hanwha–Philly Shipyard and SHIPS for America / Strategic Commercial Fleet concepts
Figures on barrels, voyage counts, and fleet size move as MARAD updates filings. Treat mid-September 2026 tracker totals as a documented floor, then add the unreported voyages Grabow and Bloomberg flagged.
The post President Trump’s 2026 Jones Act waivers moved tens of millions of barrels of U.S. energy that the domestic fleet could not carry. Freight savings are real but modest on a national scale; the larger story is avoided shortages, reopened domestic routes, and a live stress test of a 1920 law that left the United States with too few ships. appeared first on Energy News Beat.