

The official line since the energy crisis has been simple. Families and businesses are exposed because fossil-fuel prices are set internationally. After the latest Middle East shock, ministers said Britain had to “get off the fossil fuel rollercoaster” and that “when global gas prices spike, people here shouldn’t be picking up the tab.” Ofgem and Energy UK have likewise attributed recent cap increases mainly to international wholesale gas.
We highly recommend making time to read the entire report from Kathryn, and we are looking forward to interviewing her on the report and if she thinks the UK can turn it around.
Porter’s first target is that framing. British gas is not sold on a mythical global market at a single global price. The GB market uses marginal pricing. The last cargo needed to balance the system — often LNG — sets the price. Extra UK Continental Shelf gas lands on the National Transmission System and displaces that expensive last unit. It does not vanish into a world pool and come back at a world price.
There is not even one European gas price. NBP and TTF move together when pipelines have spare capacity and diverge when they do not. Since summer 2021, and in every year since 2022, Britain has been a net exporter to the Continent, including in winter. That happened because GB was often the cheaper market, insulated by UK and Norwegian pipeline gas while Europe absorbed the loss of Russian supply. In 2022, British consumers and energy-intensive industry paid substantially less than German, Dutch and Belgian counterparts. That advantage was “entirely overlooked,” Porter writes, because the dominant narrative was simply “expensive gas.”
The policy implication is blunt. If ministers believe extra North Sea gas cannot cut UK prices, they will treat licensing, tax and field approvals as climate theatre rather than price and security policy. If they accept marginal pricing, maximizing domestic production is the rational choice: cheaper than LNG, lower-carbon than LNG, and physically tied to the British grid so a cargo cannot sail to the highest bidder.
What actually broke Europe’s cheap-gas era
The structural break was not Hormuz. It was the loss of cheap Russian piped gas.
Porter says that loss “changed the cost structure of European gas, possibly permanently,” and that this change “does not appear to have been recognized by the Government.” Europe rebuilt supply around LNG and remaining Norwegian pipeline gas. That is more expensive, more seasonal, and more exposed to competition with Asia. Britain’s own balance in 2025 makes the new world visible: UKCS production of 332 TWh, about a quarter of 2000 levels; Norwegian pipeline gas of 322 TWh, 47% of demand; LNG of 137 TWh, 20% of demand. Demand itself has fallen to 680 TWh, the lowest since 1992, but not fast enough to offset the production collapse.
Hormuz matters as a shock on top of that structure, not as the origin of it. Porter records that the Strait’s closure at the end of February 2026 removed about a fifth of global LNG, lifted prices and diverted US cargoes to Asia. That is real. It is also why official briefings can sound plausible. Energy UK notes that only about 2% of UK gas comes from Gulf countries, with most supply from the North Sea, Norway and US LNG — yet wholesale prices still jumped because the marginal cargo is global and Asia can outbid Europe.
That is the distinction the report forces. A chokepoint can explain a spike. It cannot explain why Britain entered the spike with 16 days of storage, declining UKCS throughput, no decision on Rough, a fiscal regime that deters new drilling, and an official plan that treats gas as a shrinking residual.
Net Zero policy met a gas system that still has to work in January
Porter’s second charge is that current energy policy plans for a gas-free ideal rather than the system Britain actually runs.
Electricity still meets only about a fifth of UK final energy demand. Around 21 to 24 million homes remain on gas boilers. Even at the government’s 600,000 heat-pump-a-year target, full replacement would take about 40 years. Actual installations were 105,000 in 2025 and fell 18% year-on-year in Q1 2026. Industrial process heat in chemicals, refining, ceramics, glass, steel, cement and food has no ready substitute. NESO’s Clean Power 2030 plan does not eliminate unabated gas plants; it keeps them as the last-resort flexibility option after demand response, storage and interconnectors are exhausted.
That last assumption is the weak link. Britain is already importing large volumes of electricity — 44 TWh in 2025, 15% of grid supply — and is targeting 18 GW of interconnectors. Porter argues neighboring systems cannot be treated as firm capacity. Norwegian reservoirs in the NO2 area have been at or below 20-year lows. Oslo is politically cooler on acting as Europe’s battery and has refused new interconnectors. France remains the largest historic source of GB imports, but 25 of 56 reactors are over 40 years old, and the 2022 stress-corrosion episode showed how a standardized fleet can fail together. On a cold, still winter day, those shortages coincide with Britain’s own low-wind problem. Lost imports then have to be replaced by gas-fired generation, raising gas demand at the worst moment.
In other words, electrification does not retire the gas security problem. It can move it into the power market and make a gas shortage look like a blackout.
The North Sea rundown is a policy choice, not just geology
Official forecasts are often used as proof that the basin is finished. Porter says that misreads what the forecasts measure. NSTA numbers are economically recoverable reserves under the current fiscal and licensing regime, not the physical inventory.
The contrast is stark. The 2019 Oil and Gas Authority outlook saw 6.5 billion barrels of oil equivalent recoverable from the UKCS between 2025 and 2050, with a 2030 target of 1.3 million boe/d. The current NSTA case is 3.8 billion boe and a 2030 target of 0.6 million boe/d — a 40% cut. OEUK’s upside under a supportive regime is 7.5 billion boe. For gas specifically in 2025–2035, NSTA has 176 bcm against an OEUK upside of 288 bcm. The cumulative 2025–2050 gas gap is 226 bcm versus 456 bcm. Jackdaw alone, Porter notes, is large enough to displace price-setting LNG for two to four months a year.
Policy has done the rest. The Energy Profits Levy, stacked on ring-fence corporation tax and the supplementary charge, takes the headline rate to 78%.
Labor raised the levy to 38% and extended it to March 2030. The North Sea Future Plan implements a ban on new exploration licenses. Rosebank and Jackdaw have been delayed in political and legal arguments even as industry says tax reform and field approvals could unlock more than 100 projects and tens of billions of investment. Average returns have been negative. Exploration has stalled. About 25,000 North Sea jobs have been lost since the last election, and BP has signaled an exit after six decades.
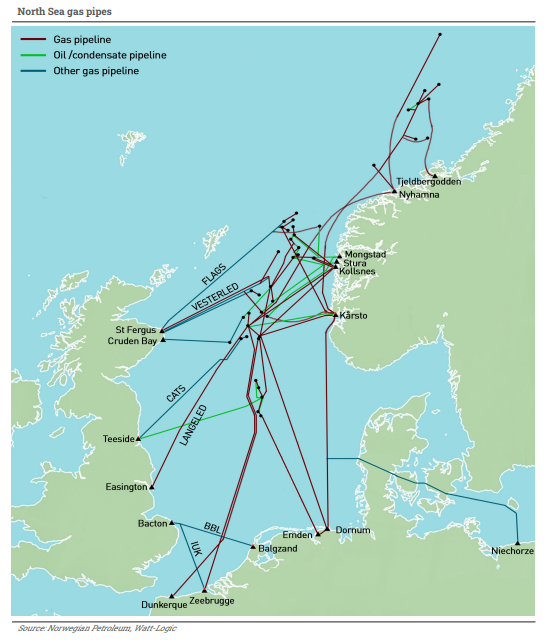
The security risk is not only fewer molecules. It is infrastructure. Offshore systems such as CATS, SAGE, FLAGS and the Forties Pipeline System need minimum throughput. Below that, hydrates, corrosion and pressure loss make continued operation uneconomic. The 2018 Theddlethorpe terminal closure, which affected 22 fields, is the precedent. NESO’s Gas Supply Security Assessment already points to UKCS peak-day supply falling from 86 mcm/d in 2024/25 to 30 mcm/d in 2030/31 and 15 mcm/d in 2035/36, import dependence above 90% on peak days in the 2030s, and failure of the N-1 test in stressed cases. Porter’s phrase for accelerating decline while demand remains strong is “lose-lose”: more import risk, no climate gain, because imported LNG has a higher carbon footprint than UKCS gas.
High bills and closing plants are not just a Hormuz story
The consumer and industrial damage was building before the latest Gulf disruption.
Porter finds gas is no longer even the primary driver of rising dual-fuel bills. Network costs have caught up with wholesale. NESO transmission charges are forecast to rise from £8.9 billion to £13.6 billion by 2030/31. Constraint and balancing costs were £1.9 billion in 2025-26 and could reach £2.4–7.2 billion by 2030, or much more without upgrades. Real electricity bills are about 40% higher than in 2017. The October–December 2026 price cap path still leaves typical bills far above winter 2021/22.
International comparisons cut against the cleanest official talking points. UK household gas prices in the second half of 2025 were 34% below the EU average. UK household electricity prices were 18% above the EU average and higher than in all but three EU states. IFS analysis says UK electricity prices are now among the highest in the developed world. Industrial electricity is the highest in the EU comparison set. That is the price of a system that still uses gas as the marginal generator, then layers carbon costs, network expansion for renewables, and constraint payments on top.
Industry is voting with shutdown notices. Official figures show factory energy use at a record low in 2025. Government called it efficiency and a shift to higher-value manufacturing. The same week, Ineos mothballed its three Hull acetyls plants — Europe’s last world-scale units of their kind — saying UK/European gas was 12 times the US price and eight times Chinese coal-based production. Sir Jim Ratcliffe called the policy mix “economic vandalism on an industrial scale.” Yara had already mothballed ammonia at Saltend in 2025. Grangemouth and Lindsey left the refining map. This is demand destruction, not decarbonization by design. The emissions often leave with the jobs, then come back embedded in imports.
Winter security: thin storage, expensive LNG, and a bid against Asia
This is the near-term test of the report.
European storage was about 61% in mid-August 2026 against a seasonal norm nearer 80%, after exiting the previous winter at 27% instead of about 40%. EU fill mandates have been relaxed. Britain holds around 16 days of demand. Centrica is willing to put £2 billion into Rough, but only with a guaranteed return the state has not granted.
Porter’s winter risk list is not exotic: further Middle East disruption, a Norwegian production or hydro problem, a US liquefaction outage, and cold still weather that lifts heating demand while killing wind output. Forward curves have shown NBP above TTF into winter, even though Britain has been a net exporter since 2022. The JKM–TTF premium has often been too thin to cover the freight difference to Asia, which is a warning that Europe may have to pay up if the Atlantic basin stays tight. If Britain and the Continent are chasing the same flexible US cargoes, they are in an auction with Northeast Asia.
The EU methane regulation adds a bureaucratic twist from 2027. Provenance rules will make spot LNG harder for Europe to buy. Britain, outside that regime, could use the window to sign long-term contracts. Or it can stay on the spot market and discover in January what “energy independence through clean power” means when the wind is down and Asia has already taken the cargo.
Is it too late?
Not yet. It is late.
The geology is not empty. The pipelines are not all closed. Norway still sends large volumes. LNG terminals have unused send-out for much of the year. Jackdaw and other sanctioned or near-field projects can still move the summer balance off LNG. Porter’s own recommendations are operational, not romantic:
Correct the market story.
- Domestic gas displaces LNG and lowers the GB price.
- Maximize UKCS output. Remove the fiscal headwinds. Approve viable fields. Treat new drilling as security policy.
- Put state support under critical offshore pipelines, on Capacity Market logic, so systems do not die from falling throughput.
- Decide on storage, including Rough, instead of another year of non-decision.
- Sign long-term LNG contracts while the EU methane rules scramble the European spot pool.
- Stop treating interconnectors as firm zero-carbon capacity. Model gas and electricity together.
- Control network spend and suspend Connect & Manage where it builds assets whose output is then constrained off.
- Apply a national-security test to energy policy: resilience, diversity, domestic capacity, and the industrial base that a crisis actually requires.
What cannot be recovered quickly is time. New wells, pipeline life-extension, storage rebuilds, and gas-plant rotors run on multi-year clocks. Heat-pump rollout is measured in decades. A licensing ban plus a 78% tax rate plus delayed field decisions is a choice to import more of the winter problem. Once a trunk line falls below minimum flow, the decline becomes a step change, not a gentle slope.
The honest conclusion of Porter’s report is that Britain still has options, but only if it stops using Hormuz and “global markets” as a blanket explanation for a system it redesigned itself. The Strait can close and reopen. Cheap Russian pipeline gas is not coming back. Net Zero timelines do not heat 21 million homes in a calm, dark January. If the UK wants energy security rather than a commentary on why security was lost, it has to produce more of its own gas, store more of it, and stop planning as if the molecule at the center of the winter system were already gone.
Making Appendices Great Again
Check out the World’s Greatest Podcast Show Notes at EnergyNewsBeat.co or EnergyNewsBeat.com.
Primary report
- Kathryn Porter / Watt-Logic, Gas Security: The Foundation of Energy Security (September 2026): https://watt-logic.com/wp-content/uploads/2026/09/Gas-Security-report-FINAL.pdf
- Watt-Logic, “New report: Gas security: The foundation of energy security,” 27 September 2026: https://watt-logic.com/2026/09/27/gas-security-the-foundation-of-energy-security/
Related Watt-Logic analysis
- “2025: the year energy security threats began to manifest”: https://watt-logic.com/2026/01/01/energy-security-threats-manifest/
- “Electrification – can the grid cope?”: https://watt-logic.com/2026/01/12/electrification-can-the-grid-cope/
- Affordability of Net Zero report: https://watt-logic.com/wp-content/uploads/2025/05/Affordability-of-net-zero-FINAL-SPREAD.pdf
Official UK statistics, regulation and policy
- DESNZ, Digest of UK Energy Statistics (natural gas): https://www.gov.uk/government/statistics/natural-gas-chapter-4-digest-of-united-kingdom-energy-statistics-dukes
- DESNZ, Quarterly Energy Prices, June 2026: https://www.gov.uk/government/statistics/quarterly-energy-prices-june-2026
- DESNZ consultation, “Gas system in transition: security of supply”: https://www.gov.uk/government/consultations/gas-system-in-transition-security-of-supply
- GOV.UK, “North Sea Future Plan for fair, managed and prosperous transition,” 26 November 2025: https://www.gov.uk/government/news/north-sea-future-plan-for-fair-managed-and-prosperous-transition
- GOV.UK, “Decisive action to break influence of gas on electricity prices,” 21 April 2026: https://www.gov.uk/government/news/decisive-action-to-break-influence-of-gas-on-electricity-prices
- House of Commons Library, Gas and electricity prices during the energy crisis and beyond (CBP-9714): https://commonslibrary.parliament.uk/research-briefings/cbp-9714/
- House of Commons Library, Domestic energy prices: In short (CBP-10958): https://commonslibrary.parliament.uk/research-briefings/cbp-10958/
- House of Commons Library, Taxation of North Sea oil and gas: https://commonslibrary.parliament.uk/research-briefings/sn00341/
- House of Commons Library, North Sea Future Plan briefing PDF: https://researchbriefings.files.parliament.uk/documents/CBP-10905/CBP-10905.pdf
- Scottish Affairs Committee, government response on Scotland’s oil and gas industry: https://publications.parliament.uk/pa/cm5901/cmselect/cmscotaf/1603/report.html
Industry, prices, winter risk and closures
- OEUK, Business Outlook Report 2026: https://oeuk.org.uk/product/business-outlook-report-2026/
- BBC, “UK could ‘unlock’ 100 more oil and gas projects, say North Sea bosses,” 14 September 2026: https://www.bbc.com/news/articles/c65ym93p73xmo
- This is Money, “North Sea has lost 25,000 jobs under Labour,” 21 September 2026: https://www.thisismoney.co.uk/money/markets/article-16149207/North-Sea-lost-25-000-jobs-Labour-Industry-chiefs-demand-windfall-tax-scrapped.html
- Telegraph, “Britain’s gas cliff-edge is drawing dangerously close,” 7 September 2026: https://www.telegraph.co.uk/business/2026/09/07/britains-gas-cliff-edge-is-drawing-dangerously-close/
- IFS, “Electricity prices”: https://ifs.org.uk/publications/electricity-prices
- Ineos, “INEOS Idles Europe’s last world-scale Acetyls plant,” 22 September 2026: https://www.ineos.com/news/shared-news/ineos-idles-europes-last-world-scale-acetyls-plant-as-energy-prices-hit-12-times-us-level/
- BBC, “Sir Jim Ratcliffe suspends production at key UK plants,” 22 September 2026: https://www.bbc.co.uk/news/articles/cw305ynd69n6o
- Yahoo Finance / Telegraph reporting on record-low factory energy use and industrial flight, 25 September 2026: https://uk.finance.yahoo.com/news/factory-energy-crashes-record-low-053000614.html
- Energy UK briefing on the Gulf and energy prices, updated 15 September 2026: https://www.energy-uk.org.uk/publications/energy-uk-briefing-the-situation-in-the-gulf-and-impact-on-energy-prices/
- Bank of England, Clare Lombardelli inflation speech, 24 September 2026: https://www.bankofengland.co.uk/speech/2026/september/clare-lombardelli-speech-at-the-sixth-biennial-conference-poland
- Carbon Brief Q&A on breaking the gas-electricity price link, 21 April 2026: https://www.carbonbrief.org/qa-how-the-uk-government-aims-to-break-link-between-gas-and-electricity-prices/
International gas-market context
- IEA, Gas 2025: https://www.iea.org/reports/gas-2025/executive-summary
- ABN AMRO, Gas Market Monitor: What a prolonged LNG supply shock could mean, 5 March 2026: https://assets.ctfassets.net/1u811bvgvthc/6dTPSCC5bvFM6Jich2JD3l/a779c552ce433a03debefd52d7e370b2/ABN_AMRO_Gas_Market_Monitor-What_a_prolonged_LNG_supply_shock_could_mean_for_gas_prices_and_inflation.pdf
The post The messaging problem: “global gas” is not how Britain actually buys gas appeared first on Energy News Beat.