

Washington spent billions to put wind, solar and batteries on the grid, and the biggest wave yet is arriving right as the tax credits run out. Here is what the data says about your bill, what it does not say, and why grid stability is the question to watch.
By Stuart Turley, host of the Energy News Beat podcast • Published Oct. 17, 2026 • Market and news items as of Oct. 16, 2026, 10 a.m. CT • Analysis and opinion; Stu’s views are labeled as his • Not investment advice
Start with your wallet
As of EIA Short-Term Energy Outlook, Oct. 6, 2026 (next update Nov. 10)
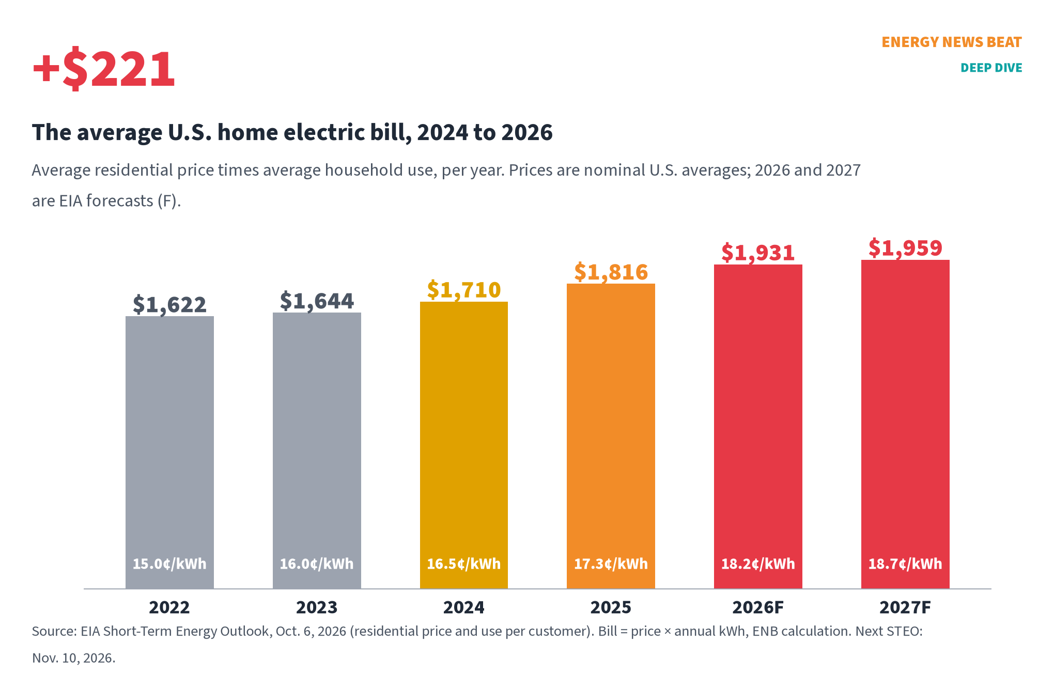
Pull out your last power bill. By EIA’s forecast, the average American household will spend about $1,931 on electricity this year, up from about $1,710 in 2024 (EIA STEO; ENB calculation, price × usage). That is about $221 more a year, or roughly $18 a month, and EIA expects another bump in 2027. Lawrence Berkeley National Laboratory (LBNL) and The Brattle Group put the climb more starkly: residential prices are up about 33% since 2019 in nominal terms, and the typical bill is about $480 a year higher (LBNL/Brattle, July 2026).
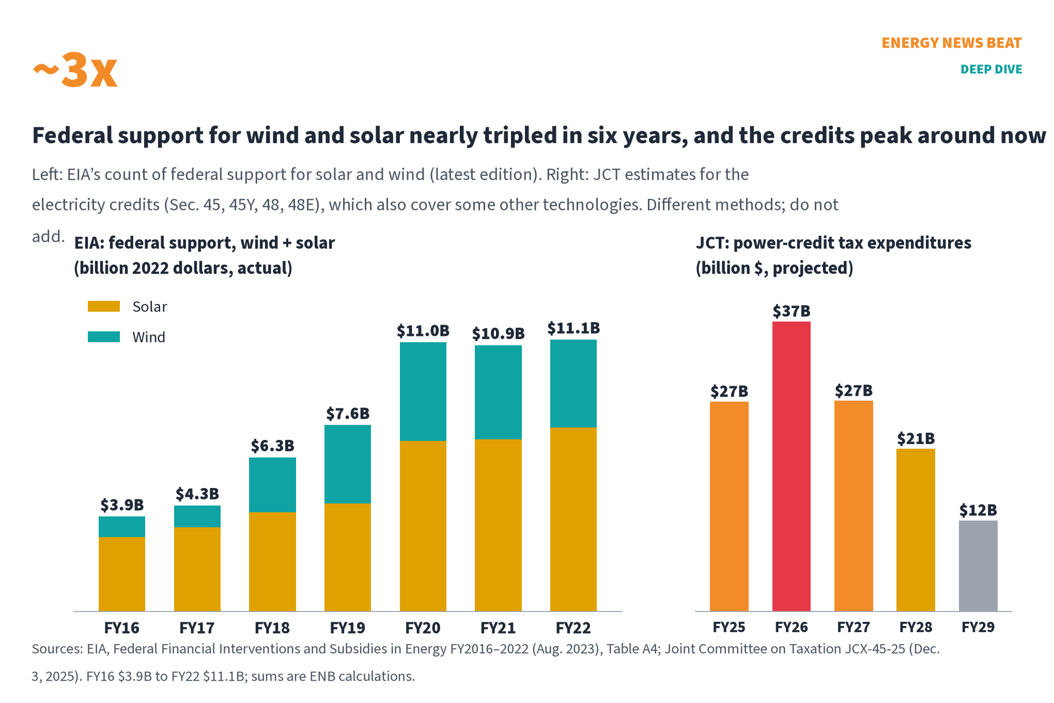
Over the same years, the grid changed. In 2010, wind and solar made 2.3% of U.S. electricity. By 2024 they made 15.6% (EIA state generation data; ENB calculation). The average residential price went from 11.54¢ to 16.48¢ per kilowatt-hour, up 43% (EIA; EIA 2024 Table 4). And federal taxpayers helped pay for the build-out: EIA counted about $11.1 billion of federal support for solar and wind in fiscal 2022 alone, nearly three times the 2016 level (EIA subsidy report; ENB sum).
Stu’s thesis, as he frames it: the more wind, solar and storage we bolt onto the grid, the more consumers pay for the grid, and the problem gets bigger, not smaller, when the subsidies end, because the projects keep coming fast and someone still has to keep the lights on. That is Stu’s view. This article tests it against the best data we could find, including the studies that disagree with him. Where the evidence backs him up, we say so. Where it does not, we say that too.
| The 60-second version
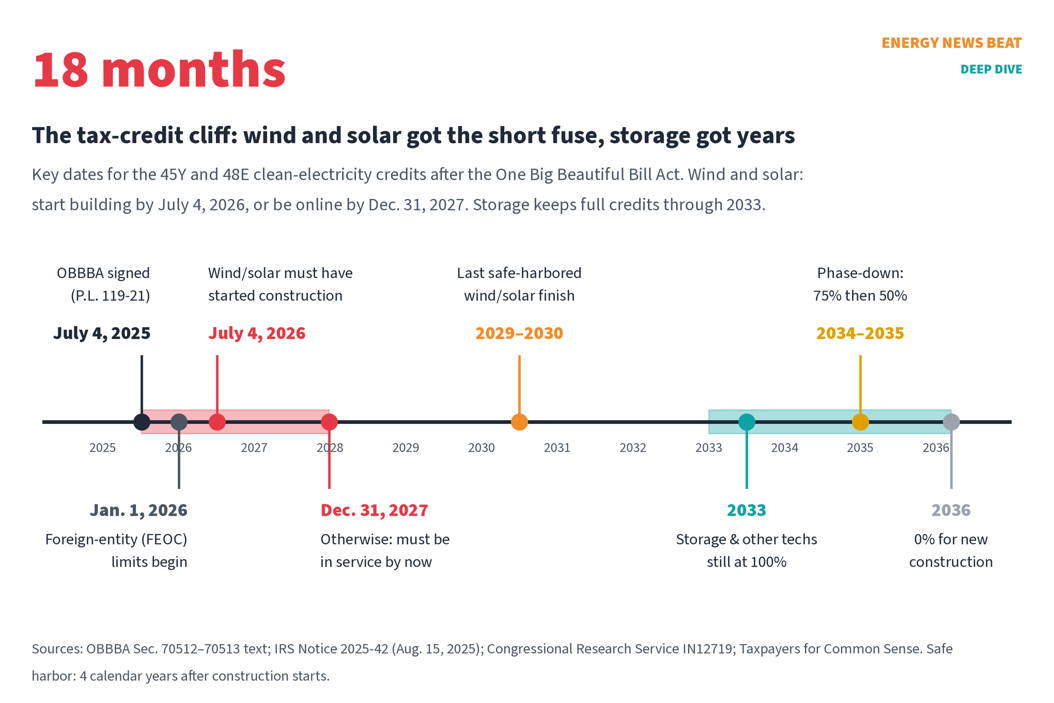
The subsidies are big, and they are ending for wind and solar. The One Big Beautiful Bill Act (signed July 4, 2025) cut off the 45Y and 48E credits for wind and solar that did not start construction by July 4, 2026, unless they are online by Dec. 31, 2027 (OBBBA text; IRS Notice 2025-42). JCT scored about $190.6 billion in savings over ten years from those two credits (JCT JCX-34-25; ENB sum). Storage keeps full credits into the 2030s (CRS). Nationally, more wind and solar and higher prices have moved together. The correlation from 2010 to 2024 is r = 0.94 (ENB calculation from EIA data). But state by state it nearly vanishes: r = -0.04. Wind-heavy Iowa and Oklahoma still have some of the cheapest power in America; California and Massachusetts have some of the most expensive. The costs Stu worries about are real, but they show up in specific places: wires, capacity markets, state mandates and backup. LBNL finds state mandates (RPS) and transmission raised prices in some states, while market-driven wind and solar did not (LBNL/Brattle). PJM’s capacity price jumped about 11-fold in four auctions (PJM). The rush is on. Developers planned a record 86 GW for 2026, 92% of it solar, storage and wind (EIA). Bloomberg reports U.S. clean-energy installations are on track for new records this year and next as developers race the tax-credit cliff (Bloomberg, paywalled; Bloomberg Technoz syndication). Grid stability is the real test. NERC says 13 of 23 assessment areas face elevated or high risk of shortfalls over ten years, and most new resources are inverter-based (NERC 2025 LTRA). Spain’s official blackout report blamed voltage control, not a lack of spinning mass alone (ENTSO-E). Stu will cover this on the Next Energy News Beat Stand Up, and we are working on recommendations for home preparations. |
| Stu’s Take (opinion)
I am not against a single solar panel or wind turbine. I am against making a family in Ohio pay twice: once on their tax return and again on their power bill. Taxpayers put $11.1 billion into solar and wind in one year, and Congress’s scorekeepers scored the IRA’s energy credits at $271 billion, and their own later CBO/JCT update put them near $786 billion (as summarized by the Tax Foundation and cited by Cato). The national picture is what my listeners live: wind and solar went from 2.3% to 15.6% of our power, and the average home price went from 11.54¢ to 16.48¢. I will be honest: the state-by-state math in this article does not prove wind and solar caused that. Iowa runs on 64% wind and solar and pays 13.4¢. But I think the hidden costs are in the wires, the backup and the mandates, and that is where the money is going. Look at PJM. Solar is counted at only 7–8% of its nameplate when the grid is stressed, and the capacity price went from $28.92 to $325 per MW-day, after peaking at $333.44. That is not all wind and solar, and the market monitor says data centers drove $6.3 billion of the $16.4 billion. But when you retire firm plants faster than you replace them, someone pays for the scramble. Now the subsidies sunset and the projects keep coming: 86 GW planned for 2026. PPA prices for wind are already up 17.5% in a year. When the tax credit goes away, that cost does not vanish. It moves from the taxpayer to the ratepayer. Price the backup into the deal, as we argued in redefining LCOE, and let every resource stand on its own. Energy security starts at home. |
Part 1. How big are the subsidies?
The credits in plain English
As of IRS and Federal Register guidance through Aug. 2025; statute as enacted July 4, 2025
For three decades, wind got a production tax credit (PTC), paid per kilowatt-hour for ten years, and solar got an investment tax credit (ITC), a percentage off the cost of building. The 2022 Inflation Reduction Act (IRA) replaced them, starting in 2025, with “technology-neutral” versions: Section 45Y (production) and Section 48E (investment). Any zero-emission power source could claim them (CRS).
- How much per kWh? For 2025, the 45Y credit is 0¢ per kWh for projects that meet prevailing-wage and apprenticeship rules, and 0.6¢ for those that do not (Federal Register, Aug. 25, 2025). For context, that 3¢ is close to a fifth of what the average household pays for a kWh.
- How much off the build cost? The 48E investment credit is generally 30% with labor rules met, plus possible 10-point bonuses for domestic content and “energy communities” (CRS).
- Storage got its own credit. Since 2023, stand-alone batteries can claim the investment credit without being paired with solar (CRS). That is one reason battery construction exploded.
- Developers can sell their credits for cash to companies with tax bills. The marketplace Crux (a tax-credit broker) estimates about $42 billion of credits changed hands this way in 2025, up from about $32 billion in 2024 (Crux; figures as reported by Crux). The One Big Beautiful Bill kept transferability but barred sales to “specified foreign entities” (SEIA fact sheet, solar trade group).
What the One Big Beautiful Bill changed
As of statute signed July 4, 2025; IRS Notice 2025-42 issued Aug. 15, 2025
The One Big Beautiful Bill Act (Public Law 119-21) did not repeal the credits for everyone. It put wind and solar on a short fuse and left most other technologies on a long one (OBBBA Sec. 70513; CRS).
| Rule | Wind and solar | Battery storage and other zero-emission sources |
| Start-construction deadline | July 4, 2026 (one year after enactment) | No near-term deadline |
| If construction started late | Must be placed in service by Dec. 31, 2027 | Not applicable |
| Continuity safe harbor | Projects that began by July 4, 2026 generally have 4 calendar years to finish | Same |
| Phase-down | Credits end for late projects | 100% for construction starting in 2033, 75% in 2034, 50% in 2035, 0% after |
| Foreign-entity (FEOC) limits | Apply from 2026 | Apply from 2026 |
| Transferability | Kept (not to specified foreign entities) | Kept |
Sources: OBBBA text; IRS Notice 2025-42; CRS IN12719; Taxpayers for Common Sense, a nonpartisan budget watchdog; SEIA, solar trade group.
Then Treasury tightened the screws. IRS Notice 2025-42 made the Physical Work Test the only way for most wind and solar projects to prove they started construction. The old “5% safe harbor,” where spending 5% of project cost counted as a start, was ended except for small solar (IRS Notice 2025-42). In plain English: you had to actually be building something, on site or at a factory under a binding contract, by July 4, 2026.
What it costs taxpayers: estimates before and after
As of JCT estimates of July 1, 2025 and Dec. 3, 2025; EIA subsidy report of Aug. 2023 (latest edition)
Before the cuts. When the IRA passed in 2022, the Joint Committee on Taxation (JCT) scored its energy credits at about $271 billion over ten years (CRS). The estimates then ballooned as companies used the credits faster than expected. A later CBO/JCT update put the energy credits near $786 billion for 2024–2033, as summarized by the Tax Foundation and cited by the libertarian Cato Institute, which also cites a Goldman Sachs estimate of $1.2 trillion (Cato). Academic modelers using EPRI’s model estimated about $780 billion through 2031 for the clean-electricity, carbon-capture and EV credits (MIT CEEPR/Brookings).
After the cuts. JCT estimated the One Big Beautiful Bill’s changes would save about $165.7 billion on the 48E investment credit and $24.9 billion on the 45Y production credit from fiscal 2025 to 2034, or roughly $190.6 billion together (JCT JCX-34-25; ENB sum). All of the bill’s energy-credit changes together saved about $499 billion (JCT). The Clean Air Task Force (an environmental group that supported the credits) says JCT now values the key clean-electricity credits at about $280 billion through 2034, versus about $490 billion in JCT’s 2023 score (CATF).
What is still being spent. The credits did not stop overnight. JCT’s December 2025 tax-expenditure tables show the main electricity credits (Sections 45, 45Y, 48 and 48E) costing about $27 billion in fiscal 2025 and peaking near $37 billion in 2026, before falling to about $12 billion by 2029, a five-year total of about $122 billion (JCT JCX-45-25; ENB sums). Those lines include some non-wind, non-solar projects, so read them as an upper bound for wind and solar.
What EIA counted. EIA’s last subsidy report covers fiscal 2016 to 2022. Federal support for all renewables roughly doubled, from $7.4 billion to $15.6 billion (2022 dollars). Solar got $7.5 billion and wind $3.6 billion in fiscal 2022 (EIA). EIA has not published a newer edition.
The other subsidy: state mandates and RECs
As of LBNL State Electricity Resource Standards data update, June 2026
Federal tax credits are only half the story. LBNL counts 27 states plus D.C. with renewable portfolio standards (RPS), and several more with clean-electricity standards. They require utilities to buy a rising share of renewable or clean power, usually by purchasing renewable energy certificates (RECs). Those costs land on your bill, not your tax return.
- LBNL estimates RPS compliance costs averaged about 5% of retail electricity bills in RPS states. In seven states it was under 1%; in four it topped 10%, with Virginia the highest, at about 20% in LBNL’s state chart, and D.C., New Jersey and Massachusetts also high (LBNL). LBNL says the highest costs come from solar carve-outs.
- REC prices vary widely. New England’s Class I RECs ran around $40 per MWh, and PJM Tier I RECs about $25 (LBNL).
- “Carve-outs” that require in-state solar are the most expensive. The mandate-critical think tank Always On Energy Research found solar RECs (SRECs) costing $407/MWh in D.C., $337 in Massachusetts and $206 in New Jersey, and estimated the in-state solar mandates cost the average customer about $298 in New Jersey and $227 in Maryland (Always On; Energy Bad Boys). Those are an advocacy group’s calculations; we report them as theirs.
Plain-English takeaway: Taxpayers carry the federal credits. Ratepayers carry the state mandates. Either way, a household pays.
Part 2. Do more wind and solar mean higher bills?
The national picture: yes, they moved together
As of EIA 2024 annual data (latest complete state-level year)
Put the national numbers side by side and Stu’s instinct looks right. Every year from 2010 to 2024, the wind-and-solar share went up, and nearly every year, the average residential price went up. The correlation is r = 0.94, where 1.0 would be a perfect match (ENB calculation from EIA and EIA price data).
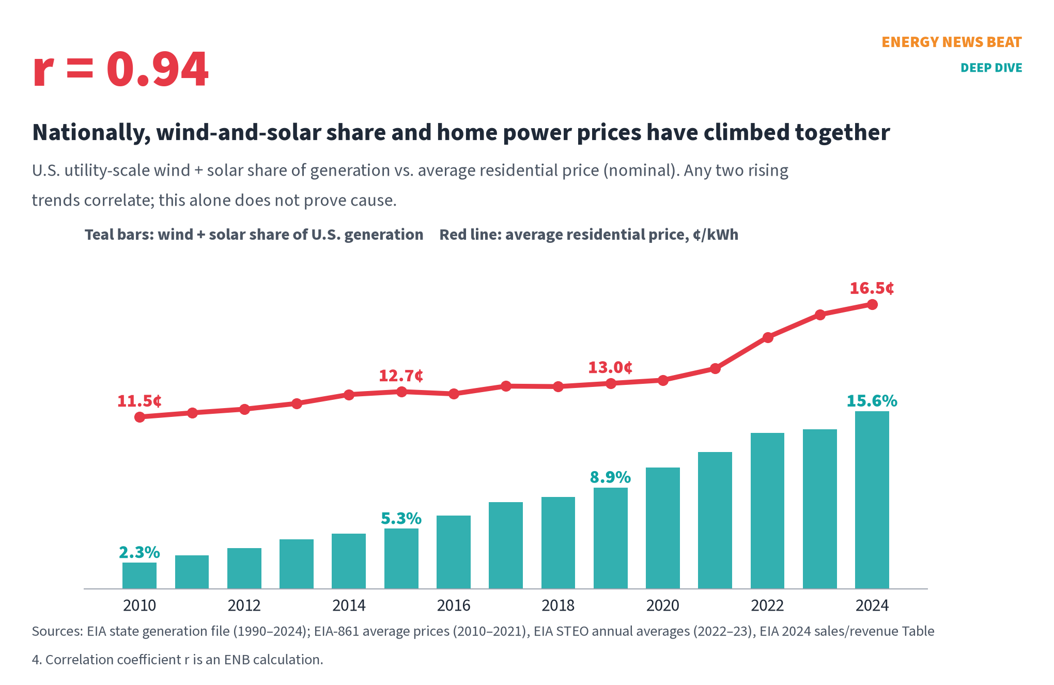
But here is the catch every statistics teacher warns about. Over the same years, the price of a gallon of milk, a pickup truck and a college degree also went up. General consumer prices rose about 44% from 2010 to 2024 (BLS CPI-U annual averages; ENB calculation), almost exactly as much as residential electricity. Two lines that both rise over time will always correlate. In fact, year-to-year changes in the two series correlate far more weakly (r ≈ 0.26, Fact Checker calculation), a sign the 0.94 mostly reflects two rising trends. To get closer to cause and effect, you have to compare places that added a lot of wind and solar with places that did not.
The state-by-state test: the link mostly disappears
As of EIA 2010 and 2024 state data
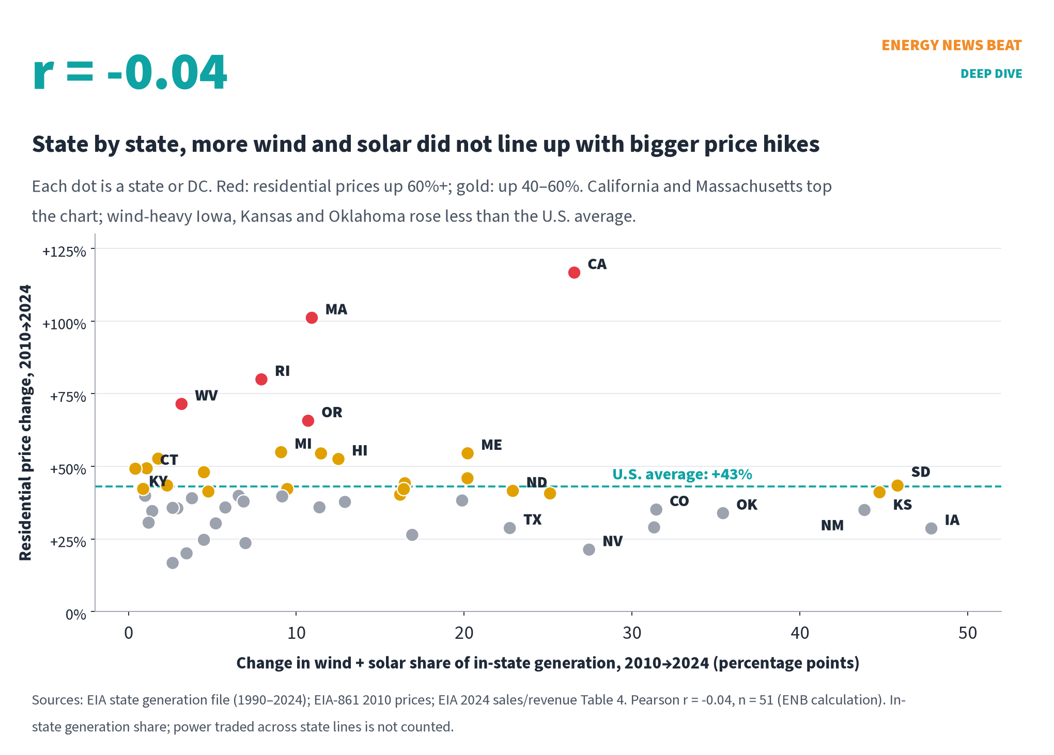
So we ran that test for all 50 states and D.C. We measured how much each state’s in-state wind-and-solar share rose from 2010 to 2024 and how much its average residential price rose (EIA generation; EIA 2010 prices; EIA 2024 prices; ENB calculation). The result: r = -0.04. That is no meaningful relationship, and if anything a slight tilt the other way. For 2019–2024 alone, the tilt is a bit stronger and still negative (r = -0.26).
| State | Wind + solar share 2010 → 2024 | Residential price 2010 → 2024 | Change |
| Iowa | 15.9% → 63.8% | 10.4¢ → 13.4¢ | +29% |
| South Dakota | 13.6% → 59.5% | 9.0¢ → 12.9¢ | +43% |
| Kansas | 7.1% → 51.9% | 10.0¢ → 14.2¢ | +41% |
| Oklahoma | 5.3% → 40.7% | 9.1¢ → 12.2¢ | +34% |
| Texas | 6.4% → 29.1% | 11.6¢ → 14.9¢ | +29% |
| California | 3.4% → 29.9% | 14.8¢ → 32.0¢ | +117% |
| Massachusetts | 0.1% → 11.0% | 14.6¢ → 29.4¢ | +101% |
| United States | 2.3% → 15.6% | 11.5¢ → 16.5¢ | +43% |
Source: EIA state generation and price data; ENB calculation. Shares are in-state utility-scale generation; prices are nominal averages.
The six states where wind and solar made 35% or more of in-state generation in 2024 (Iowa, Kansas, South Dakota, Oklahoma, Colorado and New Mexico) averaged 13.6¢ per kWh and a 36% price rise since 2010. The 16 states under 5% averaged 17.0¢ and +39% (ENB calculation, simple averages of states).
Why would that be? The Plains states built wind because the wind is strong and the land is cheap, and much of it was built for economics, not to meet a mandate. Meanwhile, some of the biggest price jumps came in states with little wind or solar at home but other heavy costs: California’s wildfire liabilities and transmission, New England’s gas pipeline limits and mandates, and West Virginia’s and Kentucky’s coal-heavy utilities rebuilding and recovering costs.
What the state test cannot see. This is a simple test, and it has limits worth saying out loud. It counts power generated in a state, not power bought from neighbors, so Massachusetts looks “low renewable” even though it pays for offshore wind contracts and out-of-state RECs. It does not separate mandate-driven projects from market-driven ones. And it does not capture costs spread across a whole region, like PJM’s capacity market. So it does not disprove Stu’s thesis. It does say that “more wind and solar in a state means higher prices” is not what the raw state data shows.
Where the costs do show up: wires
As of EIA Today in Energy, Nov. 2024; LBNL/Brattle, July 2026
The money is moving into the poles and wires. EIA reports major utilities spent about $320 billion in 2023, up from $287 billion in 2003 (real dollars). Transmission spending nearly tripled to $27.7 billion, and distribution spending reached $50.9 billion. EIA says part of that is to replace aging equipment, harden the grid against storms and wildfires, and “manage the intermittency of renewable resources” (EIA).
LBNL and Brattle found transmission charges rose about 0.8¢/kWh in ISO New England, 0.6¢ in New York, and 0.4¢ in California and PJM from 2019 to 2025, partly to connect new renewable projects, while distribution costs pushed retail prices up in 22 states from 2024 to 2025 (LBNL/Brattle). Wind farms in West Texas and solar in the desert are far from cities, so somebody has to build the line to carry their power.
Capacity markets: PJM’s shock
As of PJM 2028/29 auction results, July 14, 2026
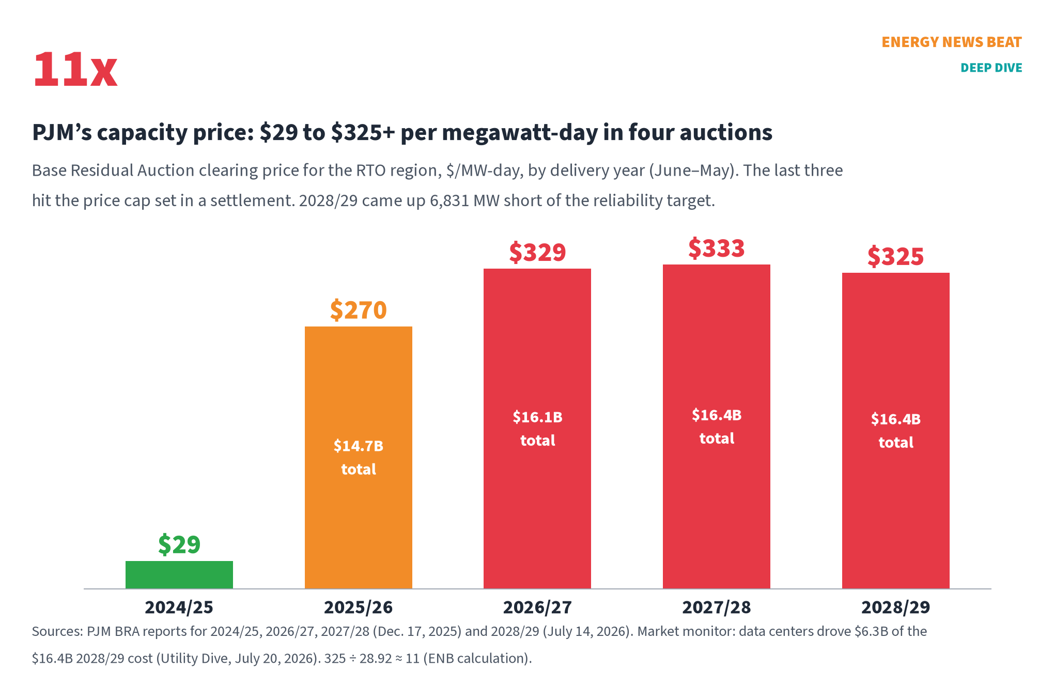
PJM runs the largest U.S. grid, serving about 67 million people in 13 states and D.C. Its capacity auction pays power plants to be available when needed. The clearing price went from $28.92 per megawatt-day for 2024/25 to $269.92, then hit the cap at $329.17, $333.44 and $325 (PJM 2024/25; PJM 2026/27; PJM 2027/28; PJM 2028/29). The 2028/29 auction cost about $16.4 billion and still came up 6,831 MW short of its reliability target (PJM).
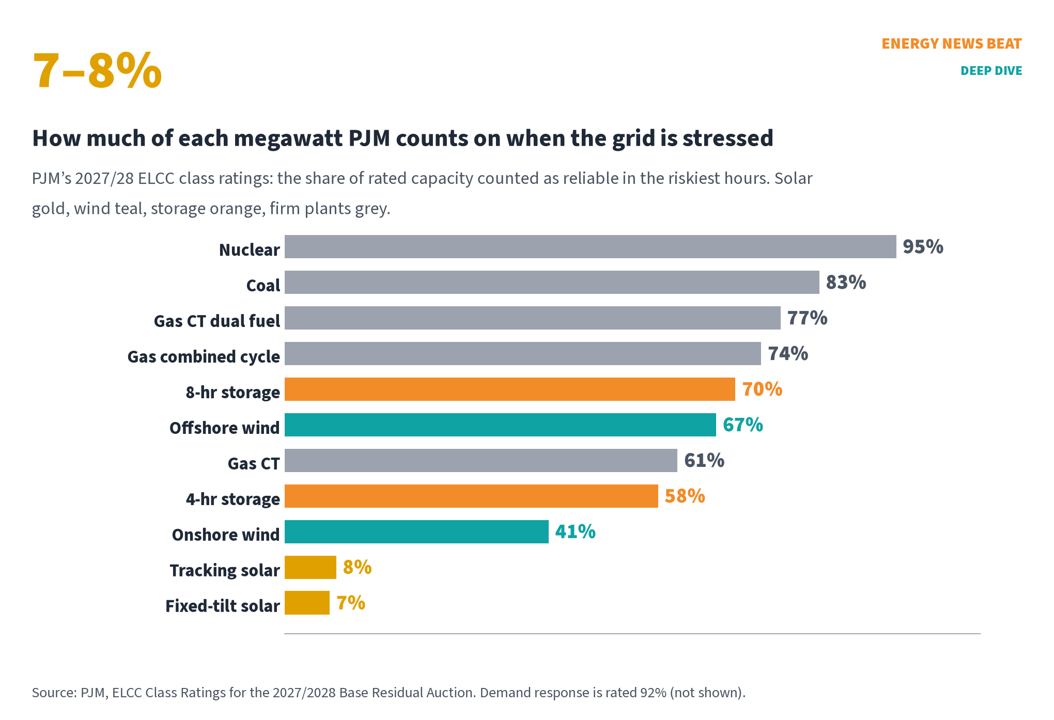
Why is this relevant to wind and solar? Because of how PJM counts them. PJM rates each resource by its Effective Load Carrying Capability (ELCC), the share of its nameplate it can count on in the riskiest hours, which are increasingly winter mornings and evenings. For 2027/28, fixed-tilt solar gets 7%, tracking solar 8%, onshore wind 41% and a 4-hour battery 58%, versus 95% for nuclear and 74% for a gas combined-cycle plant (PJM ELCC). A 100 MW solar farm counts as about 7 or 8 MW of reliable capacity.
But be fair about who drove the price. PJM’s independent market monitor says data-center load drove about $6.3 billion, or 38%, of the 2028/29 auction cost, and $29.4 billion of $63.6 billion across the last four auctions (Utility Dive, quoting Monitoring Analytics). Firm plant retirements, slow interconnection and new accreditation rules also played a part. LBNL estimates capacity costs pushed average PJM wholesale costs up about 0.9¢/kWh in 2025 compared with 2024, with another 0.6¢ expected in 2026 (LBNL/Brattle). ENB has covered the strain in PJM’s emergency actions and the 76% bill jump.
Integration, balancing and curtailment
As of EIA, CAISO market monitor 2025 annual report, Xcel 2021 study
- Balancing costs exist but are usually modest per MWh. Xcel Energy’s Colorado study (a utility that owns wind and solar) estimated integration costs of about $2.84/MWh for wind and $0.72/MWh for solar in its base case, rising with gas prices (Xcel).
- Curtailment is the tell that the grid is saturated at midday. California curtailed about 4 million MWh of wind and solar in 2024, up 29%, and 93% of it was solar (EIA). The CAISO market monitor reported downward dispatch of wind and solar up another 22% in 2025 (CAISO DMM). When power is thrown away, its fixed costs are still paid.
- Gas still has to stay on. EIA notes California keeps some gas plants online to meet reliability standards even when solar is abundant, which is part of why curtailment happens (EIA).
What high-renewable places abroad pay
As of exchange rates Oct. 16, 2026 (ECB); prices as noted
Look overseas and the high-renewable examples are expensive. German households pay about 37.0 euro cents per kWh, roughly 41.6¢ in U.S. terms; grid fees alone are 9.24 cents, and taxes and levies about a third of the bill (BDEW, German utility association; ECB; ENB conversion). Germany moved its renewable surcharge off power bills and onto the federal budget, which paid about €16.5 billion of the €18.5 billion that went to renewable generators in 2025 (pv magazine). The cost did not disappear; it moved to taxpayers.
In Great Britain, the price cap from Oct. 1 is 26.32p per kWh, about 35.1¢, excluding VAT (suspended on electricity from October 2026 to March 2027), plus a daily standing charge. Ofgem says it went up because of higher wholesale gas prices caused by the conflict in the Middle East (Ofgem; ENB conversion). South Australia gets about 44.5% of its power from wind and about a third from solar (AEMO), and its default residential offer is about A$2,334 a year including GST for 4,000 kWh, roughly 40.6¢ per kWh all in (AER; as reported in a search-index excerpt of the AER determination, because the AER site would not load for us; ENB conversion). California pays 32.0¢. Texas, with a similar wind-and-solar share, pays 14.9¢ (EIA).
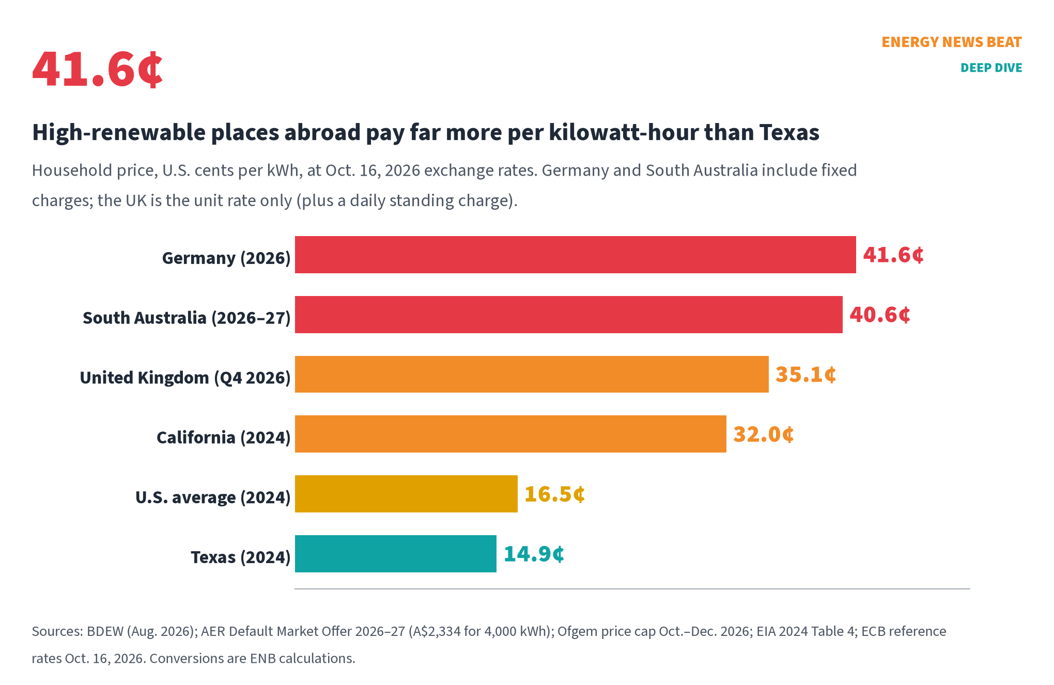
Texas versus California is the most useful comparison. Both get about 30% of their power from wind and solar. One pays twice what the other does. The difference is mostly not the turbines and panels. It is wildfire costs, transmission, rooftop-solar rules, taxes, mandates and market design.
The mandate-critical case: Energy Bad Boys and Always On
As of Energy Bad Boys and Always On Energy Research publications, Nov. 2025–Oct. 2026
Isaac Orr and Mitch Rolling, the “Energy Bad Boys” of Always On Energy Research (a mandate-critical energy think tank), have built the most detailed state-by-state case for Stu’s side (Always On). Their findings, labeled as theirs:
- States with 100% clean-energy mandates sought 32% larger rate increases since 2020 than states without them (Energy Bad Boys).
- In their 50-state profiles with the free-market Institute for Energy Research, the price gap between “blue” and “red” states widened from 6¢ (44%) in 2011 to 6.33¢ (61%) in 2025, and MISO utilities in Illinois, Michigan and Minnesota, all 100% mandate states, raised rates 28% from 2018 to 2024 versus 14.9% elsewhere (Energy Bad Boys).
- Their “Always On” cost method, which charges wind and solar for the backup needed to serve demand every hour, puts Minnesota wind at about $272/MWh and solar at about $472/MWh (Energy Bad Boys). Their 2022 study for the Center of the American Experiment (a conservative think tank) estimated Gov. Tim Walz’s proposed 100%-by-2040 carbon-free standard would cost $313.2 billion through 2050 (2022 dollars) (CAE).
- Their battery study with the National Center for Energy Analytics found a renewables-only path for PJM could cost more than $4 trillion through 2045, versus about $668 billion for gas and nuclear, and noted PJM lost about 4,500 MW of net firm capacity since 2020 while adding about 17,000 MW of wind and solar (Energy Bad Boys). Clean-energy advocates, including former DOE official Jigar Shah, have disputed this framing, as the post itself notes.
- They also argue that adding gigawatts of low-capacity-factor wind and solar, plus the transmission to connect them, lowers the overall utilization of the generation fleet, which means more steel and wire per kWh delivered (Energy Bad Boys).
Their core argument is the same as Stu’s: the cost of wind and solar is not the panel, it is the backup, the wires and the mandate. ENB has featured their work before, including on coal plant costs.
Part 3. The other side, fairly
LBNL and Brattle: market wind and solar did not drive price hikes
As of LBNL/Brattle Retail Price Trends, July 2026 update
The most thorough national study of what drives retail prices comes from LBNL and Brattle (a national lab and a consulting firm). Their 2026 update finds U.S. average prices rose 5.3% in 2025 and 29% since 2019 in nominal terms, but only about 3% after inflation since 2019, and are about 6% lower than in 2010 after inflation (LBNL/Brattle).
Their conclusion on wind and solar: “market based” wind and solar supported by tax incentives “do not appear to have driven price increases,” while binding state RPS policies often did raise prices (LBNL/Brattle).
Instead, they point to: fuel and wholesale costs (generator gas prices rose 36% in 2025); distribution spending; transmission; storm recovery; wildfire costs (more than 4¢/kWh in California); PJM capacity prices (adding about 3.1¢ in D.C., 2.0¢ in New Jersey and 1.5¢ in Maryland); and rooftop-solar net metering, which added more than 2¢ in California but less than 0.5¢ in about 40 states (LBNL/Brattle). Note the overlap with Stu’s thesis: transmission, capacity and net metering are all partly tied to how renewables are added and paid for.
Lazard: cheapest new power, with or without credits
As of Lazard LCOE+ v19.0, June 2026
Lazard, an investment bank, publishes the most quoted cost comparison. Its 2026 edition puts unsubsidized utility solar at $40–98/MWh and onshore wind at $37–99, versus $51–129 for a new gas combined-cycle plant (Lazard). With credits, wind drops to as low as $11. Lazard also estimates that renewables stay “broadly cost-competitive” with gas even after adding firming costs, using an illustrative method.
The critique, which Stu and the Energy Bad Boys make often: a levelized cost compares a megawatt-hour that shows up when the weather allows with one that shows up when you need it. That is the point of ENB’s piece on redefining LCOE. Lazard’s firming analysis is an attempt to answer that, but it is a stylized calculation, not a grid study.
Texas: wind and solar can push wholesale prices down
As of ERCOT market monitor 2025 State of the Market report, June 2026
ERCOT’s independent market monitor, Potomac Economics, reports that in 2025 natural gas prices rose 61%, yet the all-in wholesale price rose only 13.8%, from about $34 to $38 per MWh. More than 6 GW of solar came online, solar’s share of generation rose from 10.4% to 13.9%, and battery capacity grew about 80% to more than 17,000 MW (ERCOT IMM). Zero-fuel-cost power at midday and batteries shaving evening peaks both damp prices. Texas residential prices rose less than the national average from 2010 to 2024 (EIA; ENB calculation).
The caveat is reliability, not price. Texas also had Winter Storm Uri in 2021. Cheap energy most hours is not the same as power in the worst hour.
Correlation versus causation: our honest read
Here is where we land, label by label:
- Supported by the data: Nationally, wind and solar share and residential prices rose together. Federal subsidies are large. State mandates, especially in-state solar carve-outs, raise bills in the states that have them. Transmission and capacity costs are rising, and some of it is tied to adding weather-dependent resources and retiring firm ones.
- Not supported by the data we have: That states with more wind and solar saw bigger price increases. The cross-state correlation is essentially zero.
- Stu’s view, beyond the evidence: That wind, solar and storage are the main cause of rising grid costs, and that the problem will grow as subsidies sunset. That is a reasonable hypothesis about where costs are hiding (wires, backup, accreditation), but the national studies attribute most of the recent increase to other drivers, including gas, wildfires, storms, distribution upgrades and data centers.
Part 4. The sunset rush: build now, pay later?
A record wave arriving
As of EIA Feb. 20, 2026; Bloomberg Oct. 16, 2026
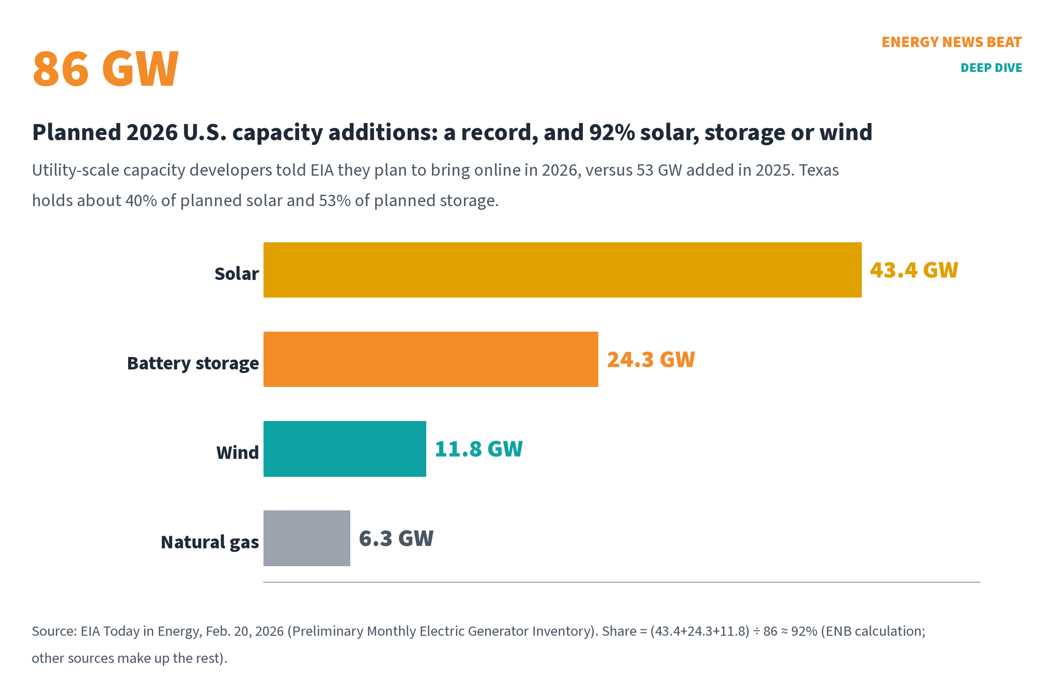
Developers told EIA they plan to add a record 86 GW of capacity in 2026, up from 53 GW in 2025: 43.4 GW of solar, 24.3 GW of batteries, 11.8 GW of wind and only 6.3 GW of gas. Texas alone holds about 40% of the planned solar and 53% of the batteries (EIA).
Bloomberg’s Oct. 16 report. On Friday, Bloomberg News published “US clean energy set to reach new highs as tax credit cliff looms” by Leslie Kaufman and Will Wade (Bloomberg). The story is paywalled, and ENB could not read the full text. What we can attribute:
- From the Bloomberg headline: U.S. clean energy is set to reach new highs as the tax-credit cliff approaches (Bloomberg).
- From the Bloomberg Technoz syndication (Bloomberg’s Indonesian partner, which published a translated version): the U.S. is on track for record clean-energy installations this year and next as developers race to use expiring tax credits and data-center demand surges; the report is based on BloombergNEF’s U.S. Clean Energy Market Outlook released Oct. 16; the syndication’s headline cites about 89 GW this year; and BNEF analyst Hall Wellborn said data-center growth still drives renewables but the picture is “tarnished” by more gas infrastructure, which reduces the climate benefit (Bloomberg Technoz, ENB translation).
- We did not see BNEF’s full outlook and have not used any other figures from the Bloomberg story.
This matches other investor data. BloombergNEF reported U.S. renewable investment in the first half of 2026 up 54% from a year earlier, with solar at $45.8 billion and wind more than doubling to $13.8 billion, and said projects that preserved credit eligibility can keep coming online until 2030 (BNEF). Crux estimates about 170 GW of projects were safe-harbored before the July 4 deadline (E&E News). Rhodium Group expects record solar installations in 2026–27 (Rhodium). Behind them sits a huge queue: about 2,290 GW of projects were waiting to connect at the end of 2024: about 1,400 GW of generation, including 956 GW of solar and 271 GW of wind, plus about 890 GW of storage (LBNL Queued Up).
This is the heart of Stu’s point: the subsidies are sunsetting, but the projects are not. Thanks to the four-year safe harbor, wind and solar that started by July 4, 2026, can keep arriving through about 2030, and storage has credits well into the 2030s. ENB covered the policy turn in “With Wind and Solar Subsidies Ending, How Will the Energy Mix End Up?”.
PPA prices: the cost shift begins
As of LevelTen Q2 2026 index, July 21, 2026 (Q3 index due Oct. 20, 2026)
Corporate buyers are already feeling it. LevelTen Energy, which runs a renewable power marketplace, reported North American wind power purchase agreement (PPA) prices up 17.5% year over year in the second quarter, while solar slipped 4.8% from the prior quarter (LevelTen). LevelTen’s market-averaged offer prices were about $83.79/MWh for wind and $61.40 for solar, as reported by mgrid.org from American Clean Power’s summary of the LevelTen index (mgrid). LevelTen said the pipeline of credit-eligible projects “will effectively freeze” after the third quarter and that PPA prices could enter “uncharted territory” with “substantial premiums” (LevelTen). LBNL also found solar and wind PPA prices up about 60% and 100% in real terms since 2020 (LBNL/Brattle).
So who absorbs the costs?
When a subsidy ends, the cost of building a wind or solar farm does not change. Who pays it does.
- Taxpayers, for now. Projects already safe-harbored will claim credits for years. JCT’s tables show tens of billions a year still flowing through 2027 (JCT).
- Ratepayers, next. Without credits, developers need higher PPA prices, which utilities pass through. Energy Innovation (a clean-energy policy think tank that supported the credits) projected the cuts would raise household energy costs about $170 a year by 2035 (Energy Innovation). Princeton’s REPEAT project (academic modelers focused on decarbonization) estimated about $165 per household per year in 2030 and more than $280 in 2035 (REPEAT). Both groups favored keeping the credits; their numbers are model projections, not measurements.
- Everyone in a capacity market. When firm capacity is short, as in PJM, every customer pays the higher clearing price (PJM).
- Data centers, if regulators make them. Several states and utilities are writing large-load tariffs so new data centers pay for their own grid upgrades. See ENB’s data-center rates coverage.
Stu’s view is that ending subsidies is right, because it makes each resource show its true cost, and that the bigger risk is the pace of intermittent additions relative to firm power. The pro-credit modelers argue the opposite: that cheap solar and wind lower wholesale prices, so cutting credits raises bills. Both can be partly right, and the outcome depends on the backup bill.
Part 5. Grid stability: the part that keeps Stu up at night
NERC’s warnings
As of NERC 2025 LTRA (Jan. 2026) and 2025–26 Winter Reliability Assessment (Nov. 2025); 2026–27 winter assessment not yet released as of Oct. 16, 2026
NERC, the grid’s reliability watchdog, says 13 of 23 assessment areas face elevated or high risk of supply shortfalls over the next ten years. Over 105 GW of generation is slated to retire in a decade, and summer peak demand is projected to grow by 224 GW. Most new resources in the next five years are solar and batteries, which NERC describes as inverter-based and, for solar, weather-dependent (NERC 2025 LTRA).
Winter is the weak spot. NERC’s last winter assessment flagged elevated risk in New England, the Maritimes, parts of the Southeast, the Northwest, the Basin and ERCOT. In Texas, it noted winter peaks come before sunrise and after sunset, when solar is not producing, and that keeping batteries charged through a multi-day storm like Uri would be “increasingly challenging” (NERC WRA). The 2026–27 winter assessment usually comes out in November.
Inertia, inverters and what Odessa taught us
As of NERC Odessa reports, 2021 and 2022
Big spinning generators (coal, gas, nuclear, hydro) store energy in their rotating mass, called inertia, which slows the grid’s frequency drop when something trips. Solar, wind and batteries connect through power electronics, or inverters, which do not provide inertia on their own and must be programmed to ride through disturbances.
- Odessa 2021: A fault at a gas plant near Odessa, Texas, on May 9, 2021, led 1,112 MW of solar to drop offline unexpectedly (NERC). ERCOT had roughly 7,200 MW of solar then, so about 15% of it tripped (ENB calculation).
- Odessa 2022: On June 4, 2022, a similar fault caused 1,711 MW of inverter-based resources to trip plus 844 MW of conventional generation, pushing frequency down to 7 Hz (NERC). NERC traced many of the trips to inverter protection and plant control settings, issues that can be fixed with better standards.
The good news: these are fixable with better standards and settings, and NERC has been pushing them. The concern: as inverter-based resources grow, the cost of getting it wrong grows too.
Spain’s April 2025 blackout: what the official report said
As of ENTSO-E Expert Panel final report, Mar. 20, 2026
On April 28, 2025, Spain and Portugal went dark. The official investigation by ENTSO-E (Europe’s grid operators’ association), with the EU regulator ACER and national regulators, published its final report on March 20, 2026 (ENTSO-E; full report). It found the blackout came from a combination of factors: oscillations, gaps in voltage and reactive-power control, rapid output reductions and disconnections, and uneven stabilization.
- Many renewable plants ran in fixed power-factor mode, so their reactive power did not respond to voltage changes (ENTSO-E report).
- Conventional plants also fell short: they met their reactive-power reference less than 75% of the time (ENTSO-E report).
- On inertia, the panel was direct: even with significantly higher inertia values, the loss of synchronism would not have been avoided (ENTSO-E report).
That is an important correction to the instant takes. Spain was not simply “too much solar, not enough spinning mass.” It was a voltage-control failure in a grid with lots of solar, rules that did not ask that solar to help, and conventional plants that did not deliver. The lesson for America is the same either way: grid rules have to keep pace with the resource mix.
Storage: helpful, but not a winter blanket
Batteries are the fastest-growing grid resource. ERCOT had more than 17,000 MW and about 31,500 MWh of storage by the end of 2025, or about 1.85 hours of average duration (ENB calculation from the ERCOT IMM). That is great for the evening peak and frequency response. NERC says batteries can improve frequency response where other inverter-based resources provide little (NERC LTRA). But a two-hour battery does not cover a five-day freeze or a week of still, cloudy weather. The Energy Bad Boys cite a 113-hour stretch when PJM wind output stayed below 1,000 MW (Energy Bad Boys). PJM rates a 4-hour battery at 58% and an 8-hour battery at 70% (PJM ELCC).
Part 6. What consumers and investors are saying
Consumers
As of AP-NORC/EPIC poll fielded July 6–24, 2026; Pew survey March 16–22, 2026
- Bills are top of mind. Pew found 75% of Americans say their home energy costs have gone up, and among them, 64% say utilities wanting to make more money is a major reason and 40% cite grid upgrades (Pew).
- Support for renewables is still broad. In the AP-NORC/EPIC poll, 63% support incentives for new renewable energy projects, but only 38% would pay a $1-a-month carbon fee (AP-NORC/EPIC).
- Data centers are the new worry. 63% are extremely or very concerned data centers will raise their electricity prices, and 73% say data centers should pay for grid upgrades (AP-NORC/EPIC).
Translation: Americans like the idea of renewables. They do not want to pay more for them, and they want whoever drives new demand to cover the cost.
Investors
As of BNEF Aug. 26 and Oct. 16, 2026; LevelTen July 21, 2026; Crux via E&E News Aug. 18, 2026
- BloombergNEF (research provider): record U.S. clean-energy installations this year and next as developers race the cliff, per Bloomberg’s Oct. 16 report as syndicated (Bloomberg Technoz); first-half 2026 investment up 54% (BNEF).
- Crux (tax-credit broker): about 170 GW safe-harbored and a record $180 billion of investment expected in 2026 (E&E News).
- LevelTen (renewable marketplace): a frozen pipeline of credit-eligible projects and “substantial premiums” ahead (LevelTen).
- Lazard (investment bank): renewables remain the cheapest new energy on a levelized basis, with or without credits (Lazard).
Investors are not walking away from wind and solar. They are pricing in a scarcity premium once the credits are gone, and a lot of that premium will be paid by utility customers.
What to watch next
- 20, 2026: LevelTen’s Q3 PPA price index, the first full quarter after the July 4 start-construction deadline (LevelTen).
- 10, 2026: EIA’s next Short-Term Energy Outlook, with updated bill forecasts (EIA).
- November 2026: NERC’s 2026–27 Winter Reliability Assessment (NERC).
- 31, 2027: the placed-in-service deadline for wind and solar that did not start construction by July 4, 2026 (IRS).
- 2029–2030: the last safe-harbored wind and solar projects come online (CRS).
- 2033–2036: storage and other zero-emission credits phase down (Taxpayers for Common Sense).
The bottom line
Wind, solar and batteries are now a big part of America’s grid, and taxpayers paid a lot to put them there. Nationally, bills have climbed alongside them. But the state-by-state data does not show that more wind and solar, on its own, means a bigger price hike. The costs Stu worries about show up in specific places: mandates, transmission, capacity markets and backup. Those are real, they are growing, and they deserve far more attention than the sticker price of a solar panel.
The subsidy cliff will not stop the build-out right away. A record wave is arriving through 2030, and when the credits run out, ratepayers pay through PPAs and capacity charges. The questions that matter for your wallet are who pays for the backup and the wires, and whether the grid can stay stable on a winter morning. Keep watching those, and keep asking your utility commission who pays. Stu will be covering this article on the next Energy News Beat Stand Up, and will offer suggestions and insights.
Have a different read on the numbers? Tell us. At Energy News Beat, we would rather be corrected than be wrong. More: ENB energy transition coverage • Energy security starts at home.
Check out the World’s Greatest Podcast Show Notes at EnergyNewsBeat.co or EnergyNewsBeat.com. And subscribe to: The Energy News Beat Substack.
Appendices
At Energy News Beat we Make Appendices Great Again. All times are U.S. Central (CDT, UTC−5) unless noted. Labels: [ENB CALC] = our arithmetic from cited figures; [AS REPORTED] = a figure we saw in a secondary source and could not open in the original; [ADVOCACY] = a figure from a group with a stated policy position, labeled with that position.
Download the data: every figure in the charts and tables is in “The Subsidy Cliff and Your Power Bill – Wind, Solar, Storage and the Grid – Data.xlsx.”
Appendix A. Sources and perspective labels
| # | Source | Publisher | Date | Perspective |
| 1 | OBBBA Sec. 70513: Termination and restrictions on clean electricity investment credit (statutory text) | One Big Beautiful Bill Act, Public Law 119-21 (text via onebigbeautifulbill.us) | Enacted July 4, 2025 | Statute (primary law) |
| 2 | Notice 2025-42: Sections 45Y and 48E Beginning of Construction | Internal Revenue Service / U.S. Treasury | Aug. 15, 2025 | Government (tax administrator) |
| 3 | Inflation Adjustment Factor and Applicable Amounts for Clean Electricity Production Credit, Calendar Year 2025 | IRS, Federal Register | Aug. 25, 2025 | Government (tax administrator) |
| 4 | Technology-Neutral Clean Electricity Tax Credits (IN12719) | Congressional Research Service | 2025 (version 4) | Nonpartisan congressional research |
| 5 | Energy Tax Provisions: Overview and Budgetary Cost (R46865) | Congressional Research Service | 2024 (version 4) | Nonpartisan congressional research |
| 6 | JCX-34-25: Estimated revenue effects of Title VII (Finance) of the Senate-passed reconciliation bill, FY2025–2034 | Joint Committee on Taxation | July 1, 2025 | Nonpartisan congressional scorekeeper |
| 7 | JCX-45-25: Estimates of Federal Tax Expenditures for Fiscal Years 2025–2029 | Joint Committee on Taxation | Dec. 3, 2025 | Nonpartisan congressional scorekeeper |
| 8 | The Budgetary Cost of the Inflation Reduction Act’s Energy Subsidies (quoting the Tax Foundation’s summary of CBO/JCT’s updated estimate; Goldman Sachs) | Cato Institute (libertarian think tank) | Mar. 11, 2025 | Libertarian think tank, critical of subsidies |
| 9 | Economic Implications of the Climate Provisions of the Inflation Reduction Act (EPRI US-REGEN: ~$780B by 2031) | MIT CEEPR / Brookings Papers (Bistline, Mehrotra, Wolfram) | 2023 | Academic research |
| 10 | Taking Stock of Energy and Climate Policy Since 2020 (JCT 2023 vs. post-OBBBA credit value) | Clean Air Task Force (environmental group that supports the credits) | 2025 | Environmental advocacy (pro-credit) |
| 11 | Clean Energy Provisions in the “One Big Beautiful Bill” (fact sheet) | Solar Energy Industries Association (solar trade group) | July 2025 | Industry trade group (pro-solar) |
| 12 | Energy Tax Provisions in the One Big Beautiful Bill | Taxpayers for Common Sense (nonpartisan budget watchdog) | 2025 | Nonpartisan budget watchdog |
| 13 | Crux 2025 Market Intelligence Report: transfer market (~$42B in 2025) | Crux (tax-credit marketplace; benefits from transfers) | Feb. 2026 | Industry (tax-credit broker) |
| 14 | Renewable investments to hit record despite Trump cuts, report says (Crux: ~170 GW safe-harbored) | E&E News by Politico | Aug. 18, 2026 | Trade press |
| 15 | Federal Financial Interventions and Subsidies in Energy in Fiscal Years 2016–2022 (Table A4) | U.S. Energy Information Administration (EIA) | Aug. 2023 (latest edition) | Government statistics (independent) |
| 16 | Net Generation by State by Type of Producer by Energy Source, 1990–2024 (annual_generation_state.xls) | EIA (EIA-906/920/923) | 2024 data | Government statistics (independent) |
| 17 | Average Price by State by Provider, 1990–2020 (avgprice_annual.xlsx) | EIA (EIA-861) | 2020 data | Government statistics (independent) |
| 18 | Electric Sales, Revenue, and Average Price, 2024: Table 4, average retail price by state and sector | EIA (EIA-861) | 2024 data (released fall 2025) | Government statistics (independent) |
| 19 | Short-Term Energy Outlook, October 2026 (residential price and usage) | EIA | Oct. 6, 2026 (next release Nov. 10) | Government statistics (independent) |
| 20 | New U.S. electric generating capacity expected to reach a record high in 2026 | EIA, Today in Energy | Feb. 20, 2026 | Government statistics (independent) |
| 21 | Grid infrastructure investments drive increase in utility spending over last two decades | EIA, Today in Energy | Nov. 2024 | Government statistics (independent) |
| 22 | Solar and wind power curtailments are increasing in California | EIA, Today in Energy | 2025 | Government statistics (independent) |
| 23 | CPI for All Urban Consumers (CPI-U), U.S. city average, all items (annual averages 2010: 218.056; 2024: 313.689) | U.S. Bureau of Labor Statistics | 2025 | Government statistics (independent) |
| 24 | Retail Electricity Price Trends and Drivers: Data Update, 2026 Edition (July 2026 update) | Lawrence Berkeley National Laboratory and The Brattle Group (Wiser et al.) | July 2026 | National lab research (DOE-funded) |
| 25 | U.S. State Electricity Resource Standards: 2026 Data Update | LBNL (Barbose) | June 2026 | National lab research (DOE-funded) |
| 26 | Queued Up: 2025 Edition, power plants seeking interconnection as of end of 2024 | LBNL | Dec. 2025 | National lab research (DOE-funded) |
| 27 | 2028/2029 Base Residual Auction results | PJM Interconnection | July 14, 2026 | Grid operator |
| 28 | PJM Auction Procures 134,479 MW of Generation Resources (2027/2028 BRA release) | PJM Interconnection | Dec. 17, 2025 | Grid operator |
| 29 | 2026/2027 Base Residual Auction report (incl. 2025/26 comparison) | PJM Interconnection | July 2025 | Grid operator |
| 30 | 2024/2025 RPM Base Residual Auction results | PJM Interconnection | July 2022 | Grid operator |
| 31 | ELCC Class Ratings for the 2027/2028 Base Residual Auction | PJM Interconnection | 2025 | Grid operator |
| 32 | Data centers drove $6.3B in PJM capacity auction costs: market monitor | Utility Dive (quoting Monitoring Analytics, PJM’s independent market monitor) | July 20, 2026 | Trade press quoting independent market monitor |
| 33 | 2025 State of the Market Report for the ERCOT Electricity Markets | Potomac Economics (ERCOT’s independent market monitor) | June 2026 | Independent market monitor |
| 34 | 2025 Annual Report on Market Issues and Performance | California ISO Department of Market Monitoring | 2026 | Independent market monitor |
| 35 | 2025 Long-Term Reliability Assessment | North American Electric Reliability Corp. (NERC) | Jan. 2026 | Grid reliability regulator (independent) |
| 36 | 2025–2026 Winter Reliability Assessment | NERC | Nov. 2025 (2026–27 edition not yet out as of Oct. 16, 2026) | Grid reliability regulator (independent) |
| 37 | Odessa Disturbance (May 9, 2021) joint NERC–Texas RE staff report | NERC / Texas RE | Sept. 2021 | Grid reliability regulator (independent) |
| 38 | 2022 Odessa Disturbance (June 4, 2022) joint NERC–Texas RE staff report | NERC / Texas RE | Dec. 2022 | Grid reliability regulator (independent) |
| 39 | Expert Panel final report on the 28 April 2025 blackout in Spain and Portugal (press release and report) | ENTSO-E (European grid operators’ association) with ACER and national regulators | Mar. 20, 2026 | Official investigation (grid operators and regulators) |
| 40 | Grid Incident in Spain and Portugal on 28 April 2025: Final Report (full PDF) | ENTSO-E ICS Investigation Expert Panel | Mar. 20, 2026 | Official investigation (grid operators and regulators) |
| 41 | 2021 Wind and Solar Integration Cost Study (Colorado) | Xcel Energy / Public Service Co. of Colorado (utility that owns wind and solar) | 2021 | Utility filing (owns wind and solar) |
| 42 | Lazard’s Levelized Cost of Energy+ (LCOE+), Version 19.0 | Lazard (investment bank / financial adviser) | June 2026 | Investment bank analysis |
| 43 | LevelTen North American PPA Price Index, Q2 2026 (highlights) | LevelTen Energy (renewable PPA marketplace) | July 21, 2026 (Q3 edition due Oct. 20) | Industry (renewable marketplace) |
| 44 | Wind PPAs reach $83.79 a MWh as solar slips to $61.40 (LevelTen Q2 market-averaged offer prices via American Clean Power, as reported) | mgrid.org (energy news site) | Sept. 5, 2026 | Trade press (secondary) |
| 45 | US clean energy set to reach new highs as tax credit cliff looms (Kaufman and Wade; paywalled) | Bloomberg News | Oct. 16, 2026 | Business news (paywalled; full text not accessed) |
| 46 | Energi Bersih AS Siap Cetak Rekor, Melonjak 89 GW Tahun Ini (Bloomberg Technoz syndication of the Bloomberg story, in Indonesian) | Bloomberg Technoz (Bloomberg’s Indonesian partner) | Oct. 16, 2026 | Business news (syndicated) |
| 47 | Renewable Energy Investments Show One Booming Sector (1H 2026) | BloombergNEF (research provider) | Aug. 26, 2026 | Industry research |
| 48 | Clean Investment Monitor: The State of US Clean Energy Supply Chains in 2026 | Rhodium Group (independent research firm) | 2026 | Independent research firm |
| 49 | BDEW-Strompreisanalyse (household electricity price, Germany) | BDEW (German energy and water industry association) | Aug. 2026 | Industry association (German utilities) |
| 50 | EEG account closes 2025 with surplus (€18.5B paid to generators; €16.5B from federal budget) | pv magazine Deutschland (citing grid-operator EEG account data) | Jan. 13, 2026 | Trade press citing official account data |
| 51 | Changes to energy price cap between 1 October and 31 December 2026 | Ofgem (GB energy regulator) | Published Aug. 2026; in force Oct. 1, 2026 | Government regulator |
| 52 | Default Market Offer 2026–27: Final determination (South Australia residential; A$2,334 incl. GST for 4,000 kWh, as reported) | Australian Energy Regulator (AER) | May 2026 | Government regulator |
| 53 | 2025 South Australian Electricity Report | Australian Energy Market Operator (AEMO) | 2025 | Grid operator |
| 54 | Euro foreign exchange reference rates (USD 1.1253, GBP 0.84385, AUD 1.6171 per euro) | European Central Bank | Oct. 16, 2026 | Central bank |
| 55 | About Always On Energy Research | Always On Energy Research (mandate-critical energy think tank; Orr and Rolling) | accessed Oct. 2026 | Mandate-critical think tank |
| 56 | States with Clean Energy Mandates Have Higher Rate Increases | Energy Bad Boys / Always On (Rolling and Orr; mandate-critical) | Nov. 29, 2025 | Mandate-critical think tank |
| 57 | All 50 Blue States, High Rates Profiles Are Live (with IER) | Energy Bad Boys / Always On (Orr, Rolling, Montalbano; mandate-critical) | Aug. 15, 2026 | Mandate-critical think tank (with free-market IER) |
| 58 | How In-State Renewable Energy Mandates Raise Electricity Costs for Everyone | Always On Energy Research (Orr and Montalbano; mandate-critical) | Sept./Oct. 2026 | Mandate-critical think tank |
| 59 | In-State Solar Mandates are Bananas | Energy Bad Boys / Always On (mandate-critical) | Oct. 10, 2026 | Mandate-critical think tank |
| 60 | We’re Winning the War on the Levelized Cost of Energy (AO-LCOE; Minnesota results) | Energy Bad Boys / Always On (mandate-critical) | June 20, 2026 | Mandate-critical think tank |
| 61 | The Battery Bubble (PJM batteries study with NCEA) | Energy Bad Boys (Rolling and Orr; mandate-critical) | July 25, 2026 | Mandate-critical think tank |
| 62 | If Grid Utilization is Good, Wind and Solar Are Bad | Energy Bad Boys (Orr and Rolling; mandate-critical) | Aug. 29, 2026 | Mandate-critical think tank |
| 63 | The High Cost of 100 Percent Carbon Free Electricity by 2040 in Minnesota (Orr, Rolling, Phelan) | Center of the American Experiment (conservative think tank; authors’ prior employer) | Sept. 2022 | Conservative think tank, mandate-critical |
| 64 | Final Analysis: Economic Impacts of U.S. “One Big Beautiful Bill Act” Energy Provisions | Energy Innovation (clean-energy policy think tank; supported the credits) | July 2025 | Clean-energy advocacy think tank |
| 65 | Impacts of the One Big Beautiful Bill on the US Energy Transition (summary) | REPEAT Project (Princeton ZERO Lab / Evolved Energy Research) | July 2, 2025 | Academic modeling (decarbonization-focused) |
| 66 | 2026 AP-NORC/EPIC Energy Survey topline (fielded July 6–24, 2026) | AP-NORC Center and University of Chicago EPIC | Sept. 2026 | Nonpartisan survey research |
| 67 | Many Americans hold utility companies responsible for rising home energy bills | Pew Research Center | May 6, 2026 (survey March 16–22) | Nonpartisan survey research |
| 68 | With Wind and Solar Subsidies Ending, How Will the Energy Mix End Up? | Energy News Beat | 2026 | ENB coverage |
| 69 | The Redefining of Levelized Cost of Energy Needs to Be Implemented to Lower Energy Prices | Energy News Beat (Publisher’s Note) | archive | ENB coverage |
| 70 | Largest US Power Grid PJM Escalates Emergency Actions to Avoid Blackouts | Energy News Beat | 2026 | ENB coverage |
| 71 | AI Buildout Drives 76% Power Bill Jump on Largest US Grid, But Is AI the Only Reason? | Energy News Beat | 2026 | ENB coverage |
| 72 | Are Data Centers Driving Up Electricity Rates? Who Is Responsible? | Energy News Beat | 2026 | ENB coverage |
| 73 | Debunking the Myth of Expensive Coal Plants: Energy Bad Boys Bring the Receipts | Energy News Beat | 2026 | ENB coverage |
| 74 | Energy Security Starts at Home: Preparing for the Grid of Tomorrow | Energy News Beat (Conversations in Energy) | archive | ENB coverage |
| 75 | Energy News Beat: energy transition coverage | Energy News Beat | ongoing | ENB coverage |
Appendix B. Key figures
| Figure | Value | Source |
| Avg. U.S. household electric bill 2024 / 2026F | $1,710 / $1,931 (+$221) | EIA STEO; ENB CALC |
| Residential price 2024 / 2026F (STEO) | 16.51¢ / 18.24¢ per kWh | EIA STEO |
| Residential price change since 2019; bill change | +33%; about +$480/yr | LBNL/Brattle |
| U.S. wind + solar share 2010 / 2019 / 2024 | 2.3% / 8.9% / 15.6% | EIA; ENB CALC |
| U.S. avg residential price 2010 / 2024 | 11.54¢ / 16.48¢ (+43%) | EIA; EIA; ENB CALC |
| National correlation, share vs price 2010–2024 | r = 0.94 | ENB CALC |
| State correlation, Δshare vs Δprice 2010–24 / 2019–24 | r = -0.037 / -0.263 (n = 51) | ENB CALC |
| States ≥35% wind+solar (6): avg 2024 price / change | 13.63¢ / +36% | ENB CALC |
| States <5% wind+solar (16): avg 2024 price / change | 16.98¢ / +39% | ENB CALC |
| CPI-U change 2010–2024 | +43.9% | BLS; ENB CALC |
| 45Y PTC, 2025 (with labor rules / base) | 3.0¢ / 0.6¢ per kWh | Federal Register |
| Wind/solar begin-construction deadline; in-service backstop | July 4, 2026; Dec. 31, 2027 | OBBBA; IRS |
| Storage phase-down (construction start) | 100% 2033; 75% 2034; 50% 2035; 0% after | TCS; CRS |
| JCT OBBBA savings FY25–34: 48E / 45Y / energy title | $165.7B / $24.9B / $499.1B | JCT |
| IRA energy credits: JCT 2022 / CBO-JCT updated estimate | $271B (FY22–31) / ~$786B (2024–33) | CRS; Tax Foundation summary cited by Cato (Mar. 11, 2025) |
| Goldman Sachs / EPRI-modeled IRA cost | $1.2T / ~$780B by 2031 (clean-electricity, CCS and EV credits) | Cato; CEEPR |
| CATF: key credits JCT 2023 vs post-OBBBA | ~$490B vs ~$280B through 2034 | CATF ADVOCACY |
| JCT tax expenditures, Sec. 45/45Y/48/48E, FY25–29 | $26.7B / $36.9B / $26.8B / $20.7B / $11.6B; total ≈$122B (JCT column totals $121.9B; yearly rows sum to $122.7B because of rounding in JCT’s tables) | JCT; ENB CALC |
| EIA federal support: solar / wind FY2022 | $7.52B / $3.59B (2022$) | EIA |
| EIA all renewables FY2016 / FY2022 | $7.4B / $15.6B | EIA |
| Credit transfer market 2024 / 2025 | ~$32B / ~$42B | Crux AS REPORTED |
| RPS compliance cost, share of bills | ~5% avg; VA ~20% (from LBNL’s state chart) | LBNL |
| SREC prices: DC / MA / NJ | $407 / $337 / $206 per MWh | Always On ADVOCACY |
| EIA utility spending 2003 / 2023 (real) | $287B / $320B; transmission $27.7B; distribution $50.9B | EIA |
| PJM BRA price 24/25 → 28/29 | $28.92 → $269.92 → $329.17 → $333.44 → $325 /MW-day | PJM |
| PJM 2028/29 cost / shortfall | $16.4B / 6,831 MW | PJM |
| IMM: data-center share of PJM costs | $6.3B of $16.4B (2028/29); $29.4B of $63.6B (4 auctions) | Utility Dive |
| PJM ELCC 2027/28: fixed solar / tracking / onshore wind / 4-hr / nuclear | 7% / 8% / 41% / 58% / 95% | PJM |
| CAISO curtailment 2024 | 3.4 million MWh (+29%; 93% solar) | EIA |
| Xcel integration cost (CO) | $2.84/MWh wind; $0.72/MWh solar | Xcel |
| Germany household price; grid fees | 37.0 ct/kWh (≈41.6¢); 9.24 ct | BDEW; ENB CALC |
| UK cap Oct.–Dec. 2026 unit rate (excl. VAT) | 26.32p/kWh (≈35.1¢) | Ofgem; ENB CALC |
| South Australia DMO 2026–27 | A$2,334 incl. GST /4,000 kWh (≈40.6¢ all-in) | AER AS REPORTED; ENB CALC |
| Lazard unsubsidized LCOE: solar / wind / gas CC | $40–98 / $37–99 / $51–129 per MWh | Lazard |
| ERCOT 2025: gas price / all-in wholesale | +61% / +13.8% ($34 → $38/MWh) | ERCOT IMM |
| EIA planned 2026 additions | 86 GW: solar 43.4, storage 24.3, wind 11.8, gas 6.3 | EIA |
| Bloomberg/BNEF Oct. 16 (syndication headline) | ~89 GW this year | Bloomberg Technoz AS REPORTED |
| LevelTen Q2 2026: wind YoY / solar QoQ; market-averaged offer prices | +17.5% / −4.8%; wind $83.79, solar $61.40 per MWh (via ACP/mgrid) | LevelTen; mgrid AS REPORTED |
| Interconnection queue end-2024 | ~2,290 GW (~1,400 GW generation incl. solar 956, wind 271; storage ~890) | LBNL |
| Bill impact of credit cuts (pro-credit models) | EI: +$170/yr by 2035; REPEAT: +$165 (2030), >$280 (2035) | EI; REPEAT ADVOCACY/ACADEMIC |
| NERC LTRA: areas at elevated/high risk; 10-yr peak growth | 13 of 23; +224 GW | NERC |
| Odessa 2021 / 2022 lost resources | 1,112 MW solar / 1,711 MW IBR + 844 MW synchronous | NERC; NERC |
| ERCOT storage end-2025 | >17,000 MW; ~31,500 MWh (≈1.85 hr) | ERCOT IMM; ENB CALC |
| Polls: costs up / utilities a major reason, among those whose costs rose (Pew); support RE incentives / DC price worry (AP-NORC) | 75% / 64%; 63% / 63% | Pew; AP-NORC |
Appendix C. Chart index and alt text
| Chart | What it shows | Source |
| 1. Household bill | Avg. U.S. electric bill 2022–2027F; +$221 from 2024 to 2026F | EIA STEO; ENB CALC |
| 2. Credit timeline | OBBBA deadlines for wind/solar vs storage | OBBBA; IRS; CRS |
| 3. Federal subsidies | EIA FY16–22 wind+solar support; JCT FY25–29 credit tax expenditures | EIA; JCT |
| 4. National trend | Wind+solar share vs residential price, 2010–2024 (r = 0.94) | EIA; ENB CALC |
| 5. State scatter | Δ wind+solar share vs Δ residential price, 51 jurisdictions (r = −0.04) | EIA; ENB CALC |
| 6. PJM capacity | BRA clearing prices and totals, 2024/25–2028/29 | PJM |
| 7. ELCC | PJM 2027/28 class ratings | PJM |
| 8. International | Household prices in US¢/kWh | BDEW; AER; Ofgem; EIA |
| 9. 2026 additions | Planned U.S. capacity additions by type | EIA |
Chart numbers above follow the article order. Image files are numbered by production order; the Publish Kit maps each file to its caption and alt text.
Appendix D. Methodology
- Wind + solar share by state. From EIA’s “Net Generation by State by Type of Producer by Energy Source” file, we used the Total Electric Power Industry rows and divided Wind plus Solar Thermal and Photovoltaic generation by Total generation, for 2010, 2019 and 2024. This is utility-scale, in-state generation; it excludes small-scale rooftop solar and does not account for imports, exports or out-of-state REC purchases.
- Residential prices. 2010 and 2019 values are EIA-861 average residential prices (Total Electric Industry). 2024 values are from EIA’s 2024 Electric Sales, Revenue and Average Price, Table 4. For the national series, 2021 is EIA-861 and 2022–2023 are EIA Short-Term Energy Outlook annual averages. All prices are nominal cents per kWh.
- Pearson correlation coefficients (r) computed across 50 states plus D.C. (n = 51), with a normal-approximation p-value. Results excluding Hawaii and Alaska are essentially unchanged (r = −0.025). We tested four specifications; none shows a positive cross-state relationship. Correlation is not causation in either direction.
- Group averages. “High” states had a 2024 wind+solar share of 35% or more (6 states); “low” states under 5% (16 states). Averages are simple, unweighted state averages.
- Bill estimate. EIA STEO average residential price × average monthly residential use × 12. ENB calculation.
- JCT tax-expenditure sums. We added corporate and individual columns for Sections 45 (renewable electricity production), 45Y, 48 (energy credit) and 48E for each fiscal year in JCX-45-25. These include some non-wind, non-solar property (e.g., geothermal, fuel cells, some storage), so they overstate the wind-and-solar portion.
- Converted at ECB euro reference rates for Oct. 16, 2026: USD 1.1253, GBP 0.84385 and AUD 1.6171 per euro (implying £1 ≈ $1.3335 and A$1 ≈ $0.6959). International prices are not perfectly comparable: Germany and South Australia include fixed charges; the UK figure is the unit rate excluding the standing charge.
- Bloomberg article. The Oct. 16, 2026 Bloomberg article is paywalled and returned an access block. We used only its headline, the Bloomberg Technoz syndication (in Indonesian, translated by ENB) and BloombergNEF’s own public pages. We did not use any figure we could not read.
- Advocacy sources. Studies from groups with a policy position (Always On Energy Research, Energy Bad Boys, Center of the American Experiment, Cato, Clean Air Task Force, Energy Innovation, SEIA, REPEAT) are labeled where they appear, and their figures are reported as theirs, not ENB findings.
Appendix E. Timeline
| Date | Event |
| 1992 | Federal wind production tax credit created (Energy Policy Act of 1992) |
| 2006 | Solar investment tax credit raised to 30% (Energy Policy Act of 2005 takes effect) |
| Aug. 16, 2022 | Inflation Reduction Act signed; JCT scores energy credits at ~$271B |
| Jan. 1, 2025 | Technology-neutral 45Y and 48E credits replace the old PTC/ITC for new projects |
| Apr. 28, 2025 | Iberian blackout (Spain and Portugal) |
| July 1, 2025 | JCT scores Senate bill: 48E savings $165.7B, 45Y $24.9B (FY25–34) |
| July 4, 2025 | One Big Beautiful Bill Act signed (P.L. 119-21) |
| Aug. 15, 2025 | IRS Notice 2025-42: Physical Work Test; 5% safe harbor ended for most wind/solar |
| Dec. 3, 2025 | JCT tax-expenditure estimates FY2025–2029 |
| Dec. 17, 2025 | PJM 2027/28 auction clears at the $333.44 cap |
| Jan. 1, 2026 | Foreign-entity (FEOC) restrictions begin |
| Jan. 2026 | NERC 2025 Long-Term Reliability Assessment |
| Feb. 20, 2026 | EIA: record 86 GW of additions planned for 2026 |
| Mar. 20, 2026 | ENTSO-E Expert Panel final report on the Iberian blackout |
| July 4, 2026 | Wind/solar begin-construction deadline |
| July 14, 2026 | PJM 2028/29 auction: $325/MW-day, 6,831 MW short |
| July 21, 2026 | LevelTen Q2 2026 PPA index: wind +17.5% YoY |
| Oct. 16, 2026 | Bloomberg/BNEF: U.S. clean energy set for new highs as cliff looms |
| Oct. 20, 2026 | LevelTen Q3 2026 PPA index due |
| Nov. 2026 | NERC 2026–27 Winter Reliability Assessment expected |
| Dec. 31, 2027 | Placed-in-service deadline for wind/solar that did not begin construction by July 4, 2026 |
| ~2029–2030 | Last safe-harbored wind/solar projects due online |
| 2033–2036 | Storage and other zero-emission credits phase down to zero |
Timeline sources: those cited in the article and in Appendix A; the 1992 and 2006 history entries are general background from CRS.
Appendix F. Glossary
- PTC / ITC: production tax credit (per kWh, 10 years) / investment tax credit (percent of build cost).
- 45Y / 48E: the technology-neutral clean-electricity production and investment credits that started in 2025.
- Safe harbor / begin construction: IRS rules for when a project counts as started; once started, projects generally have four years to finish.
- Transferability: selling tax credits for cash to another taxpayer.
- RPS / REC / SREC: renewable portfolio standard / renewable energy certificate (1 MWh of renewable output) / solar REC.
- Capacity market (BRA): PJM’s Base Residual Auction, which pays resources to be available three years ahead.
- ELCC: effective load carrying capability, the share of a resource’s capacity counted as reliable in the riskiest hours.
- Curtailment: deliberately reducing wind or solar output because the grid cannot use or move it.
- Inertia: stored rotational energy in spinning generators that slows frequency changes.
- IBR: inverter-based resource (solar, wind, batteries).
- LCOE: levelized cost of energy, the average lifetime cost per MWh, which does not by itself include backup or grid costs.
- PPA: power purchase agreement, a long-term contract to buy a project’s output.
Appendix G. Related ENB coverage
- With Wind and Solar Subsidies Ending, How Will the Energy Mix End Up?
- The Redefining of Levelized Cost of Energy Needs to Be Implemented
- Largest US Power Grid PJM Escalates Emergency Actions to Avoid Blackouts
- AI Buildout Drives 76% Power Bill Jump on Largest US Grid
- Are Data Centers Driving Up Electricity Rates? Who Is Responsible?
- Debunking the Myth of Expensive Coal Plants: Energy Bad Boys Bring the Receipts
- Energy Security Starts at Home: Preparing for the Grid of Tomorrow
- ENB energy transition coverage
Appendix H. Corrections, caveats and items not independently verified
- Bloomberg (Oct. 16, 2026) is paywalled. We did not read the full article. Points are attributed to its headline and the Bloomberg Technoz syndication; the ~89 GW figure comes from the syndication’s headline and was not confirmed in BNEF’s full outlook.
- AS REPORTED figures: the AER South Australia default offer of A$2,334 including GST (the AER site and PDF would not load during writing or fact-checking; the figure comes from a search-index excerpt of the AER determination); LevelTen market-averaged offer prices (from mgrid.org, citing American Clean Power’s summary of the LevelTen index); the Goldman Sachs $1.2T IRA estimate (as cited by Cato). The CBO/JCT ~$786B estimate is quoted from the Tax Foundation’s summary, as cited by Cato (Mar. 11, 2025).
- Corrections before publication (Oct. 16, 2026): LevelTen dollar figures relabeled as market-averaged offer prices (not P25); $786B attributed to CBO/JCT’s updated estimate via the Tax Foundation; LBNL’s PJM capacity effect described as wholesale cost; LBNL’s 22-state distribution finding dated 2024–2025; the PJM 2024/25 total-cost figure removed because the cited report does not state it.
- State correlation limits: in-state generation only; no control for mandates, fuel mix, weather, wildfire costs or regional capacity markets. It is a descriptive test, not a causal model.
- Tax-expenditure totals include some technologies other than wind and solar.
- International comparisons use one day’s exchange rates and differing tariff structures.
- Advocacy studies (on both sides) are reported as the authors’ findings.
- Spot a mistake? Tell us and we will correct it and note the change here.
The post The Subsidy Cliff and Your Power Bill: Wind, Solar, Storage and the Grid appeared first on Energy News Beat.