Comparing the Baker Hughes weekly census, the WellDatabase rig report, and the Enverus daily GPS count.
The U.S. rig market spent the week doing two things at once. The two weekly censuses ticked higher. The daily GPS count eased. All three tapes remain higher than they were a year ago.
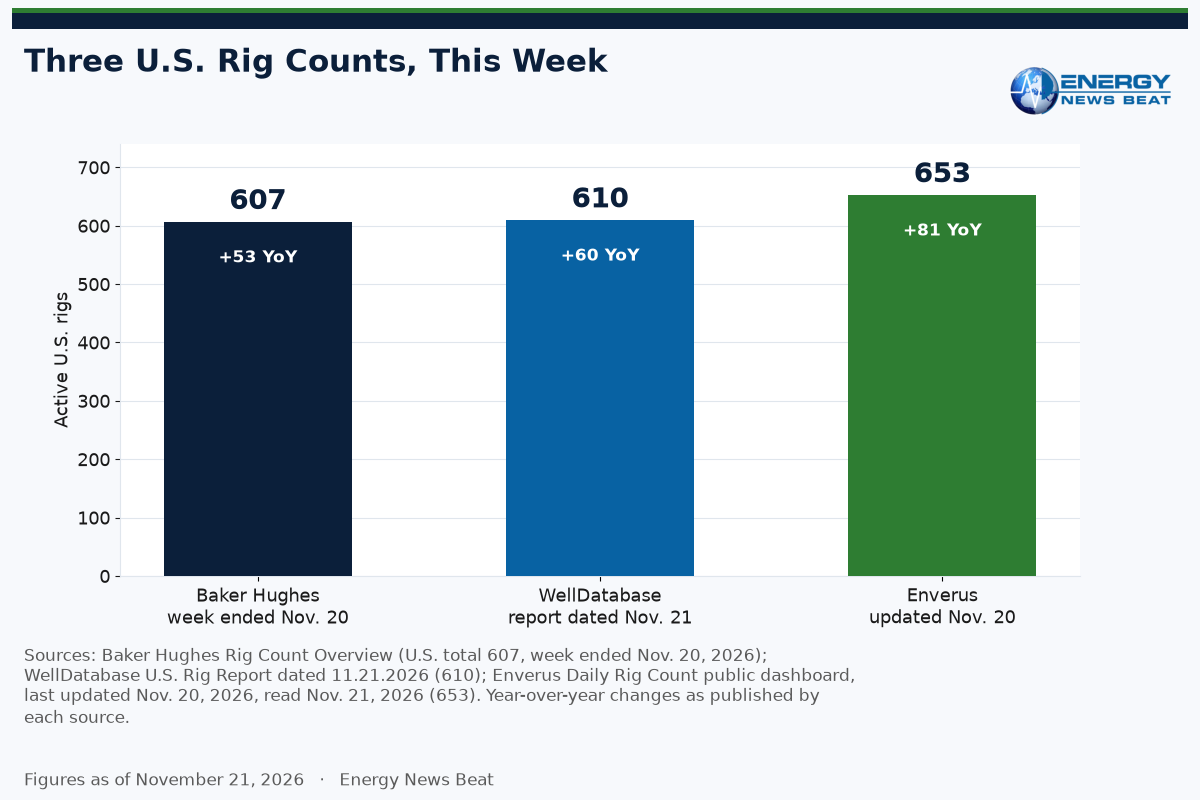
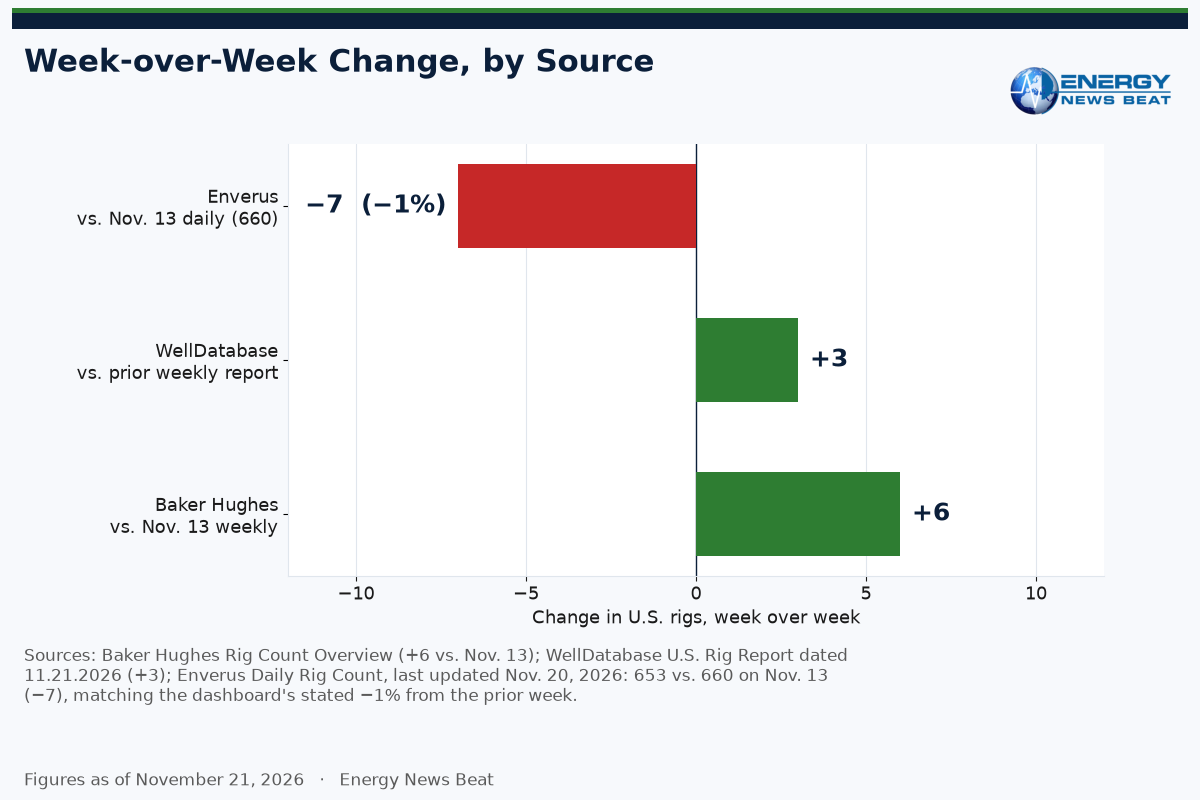
Baker Hughes published a U.S. rotary count of 607 for the week ended November 20, 2026, up 6 from the prior week and up 53 from 554 on November 21, 2025. Oil-directed rigs rose 6 to 469, gas-directed rigs rose 1 to 128, and miscellaneous rigs fell 1 to 10, according to contemporaneous reports of that release. WellDatabase‘s U.S. Rig Report dated November 21, 2026, showed 610 total rigs, up 3 on the week and up 60 from a year earlier, with oil at 441 (up 5, up 59 year-over-year) and gas at 124 (up 1, down 6 year-over-year). Enverus‘ public Daily Rig Count, last updated November 20, 2026, stood at 653, a 1 percent decline from the prior week on the company’s dashboard and down 7 from the 660 rigs Enverus recorded on November 13. Enverus’ year-over-year change on that same dashboard is up 81, or 14.2 percent.
The three sources measure different things, on different clocks. Read together, they describe a market that is still firmer than last November, led by oil-directed work in the Permian.
Why the Three Counts Differ
Baker Hughes has taken a weekly census of North American rotary rigs since 1944. Its FAQ says a rig counts as active only if it is on location and “drilling or ‘turning to the right’ for 4 out of 7 days during a week,” from spud to target depth, “actively exploring for or developing oil, natural gas, or geothermal energy.” Rigs in transit, rigging up, or doing workovers, completions, or production testing are not counted. The count is released at noon Central Time on the last workday of the week. Because of Thanksgiving, Baker Hughes will publish the next print on Wednesday, November 25, 2026, instead of Friday, November 27.
WellDatabase says it “provides a rig report using data from Baker Hughes, cross-referenced with permit records in our database.” That is why its 610 sits close to Baker Hughes’ 607, and why the two often agree on the big basins while still differing on some state and basin lines and on the oil-versus-gas split. The WellDatabase report is dated November 21, a day after the Baker Hughes week ended November 20. Some of the three-rig gap may be timing, and some the permit match — an inference, not a figure either company printed.
Enverus says it tracks “more than 95 percent of the U.S. rig fleet on a daily basis, primarily through the use of GPS units.” Baker Hughes’ FAQ says other companies “define activity differently,” and may count rigs not “actively drilling as we define it.” A daily GPS snapshot will tend to run higher than a weekly census that counts only rigs turning to the right for four days out of seven. Daily totals this week ranged from 653 to 664.
Oil and Gas
Oil did the lifting in the weekly counts. Baker Hughes’ oil-directed count rose 6 to 469, which contemporaneous reports put 50 above the 419 working a year earlier. Gas-directed rigs rose 1 to 128, one more than a year ago. Miscellaneous rigs fell 1 to 10. Land rigs rose 4 to 591, inland-water rigs were unchanged at 1, and offshore rigs rose 2 to 15, including a two-rig gain in the Gulf of Mexico to 14.
WellDatabase’s well-type table is built from permit records, so it will not match that split one for one. Oil wells rose 5 to 441, up 59 from 382 a year earlier. Gas wells rose 1 to 124, down 6 from 130 a year earlier. Thermal wells were unchanged at 10, up 5 year-over-year. Undisclosed wells fell 2 to 35. Horizontal wellbores rose 6 to 506. Enverus’ public dashboard does not publish an oil-versus-gas split.
States and Basins
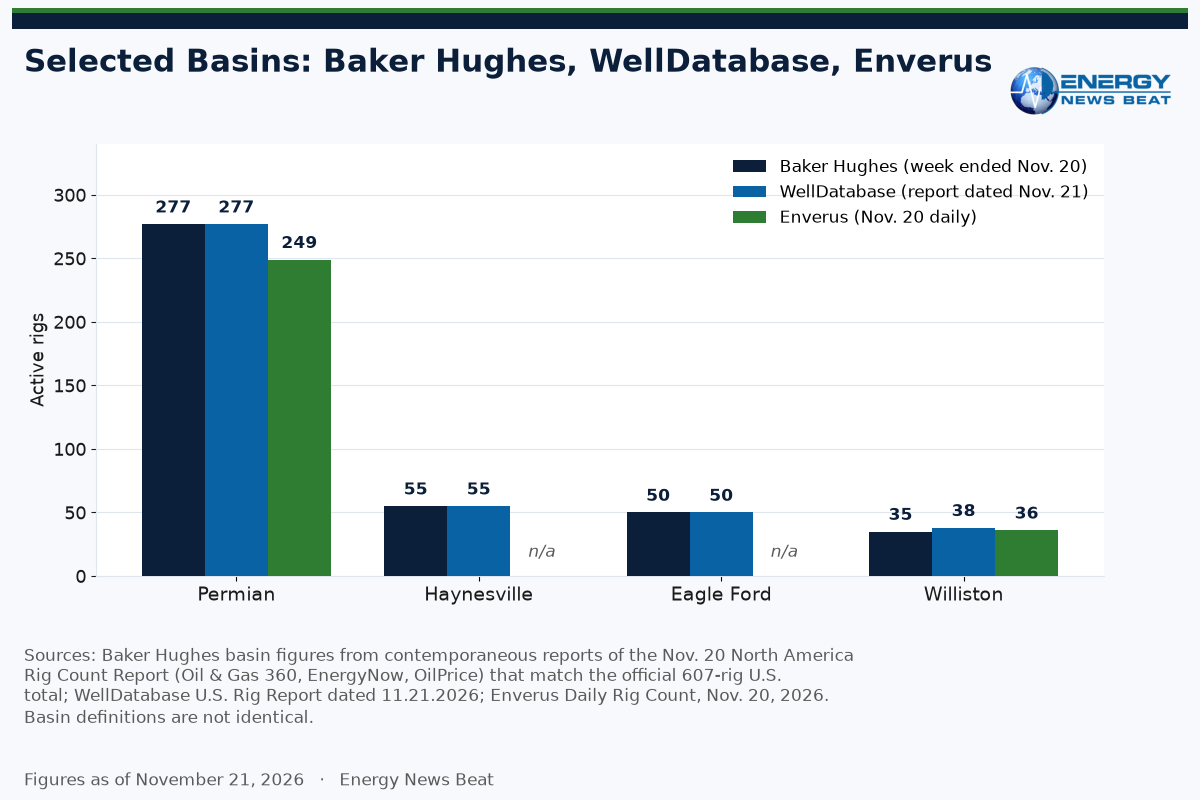
On the major states, Baker Hughes and WellDatabase are close. Both put Texas at 278, up 1 on the week. WellDatabase’s year-ago Texas figure is 226, up 52; a contemporaneous report citing the Baker Hughes report puts that year-over-year change at up 44. New Mexico is 103 in both, up 1. Louisiana is 39 in both, up 2. Utah and Wyoming are each 19 in both, each up 1. Alaska is 11 in both, up 1. Oklahoma is 49 in WellDatabase, unchanged and up 8 from 41 a year earlier. A matching Baker Hughes Oklahoma figure was not in the contemporaneous reports cited below. North Dakota is the clearest weekly disagreement: WellDatabase 35, down 2; Baker Hughes 32, up 1. The Williston Basin tells the same story: WellDatabase 38, down 3; Baker Hughes 35, unchanged; Enverus 36 on November 20, up 5 from a year earlier.
The Permian remains the center of gravity. WellDatabase and Baker Hughes both show 277 Permian rigs, up 2 on the week — over 45 percent of both weekly U.S. totals. WellDatabase’s year-ago figure is 251, up 26; reports citing Baker Hughes put the basin 23 above 254 a year earlier. Enverus’ Permian reading on November 20 was 249, down 2 from the prior day and up 21, or 9.2 percent, from a year earlier. Enverus’ national total still runs higher. A large residual — 186 rigs — sits in its “Other” category, likely a basin-definition difference (an inference). The Haynesville rose 2 to 55 in both WellDatabase and Baker Hughes, up from 41 a year earlier in both. The Eagle Ford was unchanged at 50 in both weekly sources (WellDatabase up 11 from 39; reports of Baker Hughes put it 9 above a year earlier). Granite Wash, Marcellus, and Cana Woodford were unchanged in WellDatabase at 23, 23, and 18, matching the Baker Hughes basin table published by Oil & Gas 360. Enverus reports a Gulf Coast Basin (including Eagle Ford) of 75 on November 20, plus Anadarko at 64, Appalachia at 32, and the DJ Basin at 11.
Operators
WellDatabase’s operator table is one reason to read that report alongside the Baker Hughes census. The largest named line this week is EOG Resources at 21, up 2. Continental Resources is unchanged at 20, up 9 from 11 a year earlier. Diamondback Energy and Pioneer Natural Resources are each 19 (Diamondback down 1, Pioneer up 2). Devon Energy Production Company dropped 5 to 18, the largest weekly decline among the named operators. Chevron is 13, up 3. Mack Energy jumped 5 to 13 and is up 13 from zero a year earlier. Permian Resources Operating is 15, up 1, and Validus Energy II Midcon is unchanged at 12. A residual “Unknown” category remains the single largest line, at 26, down 7 from 33. Horizontal work still dominates: 506 of the 610 rigs, with 242 in the 10,000- to 15,000-foot depth range and 113 deeper than 20,000 feet.
Consumer and Investor Views
For consumers, a rig count is not a gasoline-price forecast, and a six-rig week will not show up at the pump. The three tapes say U.S. drilling is still running higher than last November, with oil-directed work leading the weekly gain and the Permian carrying just over 45 percent of the weekly counts. More wells in the pipeline generally support future supply. They do not tell you what diesel or heating oil will cost this winter. A 1 percent dip on the Enverus daily count is not a supply shock, and a 6-rig rise on Baker Hughes is not a sudden surge.
For investors, the year-over-year picture remains oil-directed strength, Permian leadership, and a Haynesville rebound on the weekly tapes after a softer gas week on the prior Baker Hughes print (601 total for the week ended November 13, with gas-directed rigs down 4 to 127). The Enverus count, still in the mid-650s, continues to show a broader working fleet than the traditional weekly census alone. The weekly divergence is a reminder to watch the trend across all three, not a one-week print. None of that is a recommendation to buy or sell any security. Not investment advice. Risks run both ways: weaker crude or gas prices could slow activity, and efficiency gains mean a lower count is not automatically a production cut. Because Enverus updates daily, the 653 print from November 20 can be revised.
Caveats
Baker Hughes’ U.S. total of 607, up 6 on the week and up 53 from a year earlier, is from Baker Hughes’ own rig-count overview. The oil, gas, miscellaneous, land, offshore, state, and basin breakdowns attributed to Baker Hughes come from contemporaneous reports that cite the November 20 North America Rig Count Report, including Oil & Gas Journal, OilPrice, EnergyNow, Oil & Gas 360, and SquawkNews, which agree on the 607-rig U.S. total and on the major splits cited here. WellDatabase figures are taken from the company’s four-page U.S. Rig Report dated November 21, 2026, without rounding. Enverus figures are from the public Daily Rig Count dashboard as it stood on November 21, 2026, last updated November 20, 2026; that dashboard can revise recent daily values.
Stu’s Take
The three rig counts are telling the same year-over-year story and a slightly different week-over-week one. Baker Hughes and WellDatabase both moved up this week, to 607 and 610. Enverus, which counts rigs every day with GPS under a broader definition, eased to 653, down about 1 percent from a week earlier. That is not a contradiction. It is three cameras, three shutter speeds, pointed at the same oilfield. What matters for families and for anyone watching supply is the year-ago comparison: all three counts are still higher than last November, with the Permian doing the heavy lifting on the weekly counts and oil-directed rigs leading the Baker Hughes gain. A six-rig week is not a boom, and a 1 percent dip on the daily tape is not a bust. Keep an eye on the next Baker Hughes print, which moves to Wednesday, November 25, because of Thanksgiving.
[STU: OK or edit]
Appendix A. Sources
Baker Hughes, Rig Count Overview & Summary Count, https://bakerhughesrigcount.gcs-web.com/rig-count-overview/, accessed November 21, 2026. U.S. total 607 for the count dated 20 Nov 2026, +6 vs. 13 Nov 2026, +53 vs. 21 Nov 2025; Canada 231, −2, +36; holiday publication schedule, including Wednesday, November 25, 2026, for Thanksgiving week; noon Central release.
Baker Hughes, Rig Count FAQs, https://bakerhughesrigcount.gcs-web.com/rig-count-faqs/, accessed November 21, 2026. North America methodology, including the “turning to the right” four-of-seven-days test, from spud to target depth, and exclusions for transit, rig-up, workovers, completions, and production testing.
Baker Hughes, North America Rig Count page, https://bakerhughesrigcount.gcs-web.com/na-rig-count/, accessed November 21, 2026. Lists a North America Rig Count Report dated 11/20/26 (7.3 MB). Breakdowns below come from contemporaneous reports that cite it and that match the official 607-rig U.S. total.
Oil & Gas Journal, “Baker Hughes: US rig count up 6 units to 607,” November 20, 2026, https://www.ogj.com/drilling-production/news/55420698/baker-hughes-us-rig-count-up-6-units-to-607. Land, inland-water, and offshore splits; oil and gas counts; selected state counts; Canada oil and gas.
OilPrice, Julianne Geiger, “U.S. Oil Drillers Pick Up the Pace Just as Oil Prices Fall,” November 20, 2026, https://oilprice.com/Energy/Energy-General/US-Oil-Drillers-Pick-Up-the-Pace-Just-as-Oil-Prices-Fall.html. Miscellaneous rigs 10, −1; Permian 277, +2, +23 year over year; Eagle Ford 50, unchanged, +9 year over year; oil +50 year over year.
EnergyNow, “U.S. Rig Count Climbs to 607 as Oil Drilling Rises Despite Weaker Crude Prices,” November 20, 2026, https://energynow.com/2026/11/u-s-rig-count-climbs-to-607-as-oil-drilling-rises-despite-weaker-crude-prices/. Cites the Baker Hughes North America Rig Count Report, November 20, 2026. Oil 469 / gas 128 / misc. 10; Permian 277, +2, from 254 a year earlier; Haynesville 55, +2, from 41; Texas 278, +44 year over year; Gulf of Mexico 14, +2; U.S. offshore 15, +2.
Oil & Gas 360, “U.S. rig count increased by 6, is at 607,” November 20, 2026, https://www.oilandgas360.com/baker-hughes-rig-count-11-20-2/. Named-basin table used in Appendix C. The article’s body line that the U.S. “increased by 36” is a typo (601 + 6 = 607; the headline correctly says +6) and is not used.
SquawkNews, “US Baker Hughes Rig Count 20-Nov: 607 (prev 601),” updated November 20, 2026, https://squawknews.com/news/969572-us-baker-hughes-rig-count-20-nov-607-prev-601. Oil 469 (prev. 463); gas 128 (prev. 127).
WellDatabase, U.S. Rig Report dated 11.21.2026, four-page PDF report. Every WellDatabase figure in the article and tables is read from that PDF, without rounding. Methodology: WellDatabase, “What is a Rig Report?,” https://support.welldatabase.com/knowledge/what-is-a-rig-report, accessed November 21, 2026.
Enverus, Daily Rig Count public dashboard, https://app.drillinginfo.com/drc/, read November 21, 2026, last updated November 20, 2026. Headline 653, −1% from the prior week; basin table for November 13–20; methodology statement that Enverus tracks more than 95 percent of the U.S. rig fleet daily, primarily by GPS.
EnergyNow, “U.S. Rig Count Slips to 601 as Natural Gas Drilling Declines and Permian Activity Rises,” November 14, 2026, https://energynow.com/2026/11/u-s-rig-count-slips-to-601-as-natural-gas-drilling-declines-and-permian-activity-rises/. Source for the prior Baker Hughes print cited in the Investor View: “Gas rigs fell by four to 127, while oil rigs remained unchanged at 463.”
Prior Energy News Beat weeklies used for format, not for this week’s figures: November 16, 2026, https://energynewsbeat.co/crude-oil/rigs-down-in-the-us-as-we-compare-enverus-welldatabase-and-baker-hughes-rig-counts/; November 7, 2026, https://energynewsbeat.co/crude-oil/energy-news-beat-weekly-rig-report-comparing-baker-hughes-enverus-and-welldatabase-for-the-overall-market-view/.
Appendix B. Three-Source Headline Comparison
Table B. Headline U.S. counts
| Source | As-of / date | U.S. rigs | Week change | Year change |
| Baker Hughes | Week ended Nov. 20, 2026 | 607 | +6 vs. Nov. 13 | +53 vs. 554 on Nov. 21, 2025 |
| WellDatabase | Report dated Nov. 21, 2026 | 610 | +3 | +60 |
| Enverus | Dashboard last updated Nov. 20, 2026 | 653 | −7 vs. 660 on Nov. 13 (−1%) | +81 (14.2%) |
Sources: Baker Hughes Rig Count Overview; WellDatabase U.S. Rig Report dated 11.21.2026; Enverus Daily Rig Count public dashboard, read November 21, 2026. Enverus week change is the Nov. 20 vs. Nov. 13 daily totals, matching the dashboard’s stated −1% from the prior week.
Appendix C. Baker Hughes Breakdowns
U.S. total, week-over-week change, and year-over-year change are from Baker Hughes’ own overview. The splits below are from contemporaneous reports that cite the November 20 North America Rig Count Report and that match the official 607-rig total.
Table C1. Baker Hughes oil, gas, location, and Canada
| Split | This week | Week change | Year ago / year change | Source of the split |
| U.S. total | 607 | +6 | 554 / +53 | Baker Hughes overview |
| Oil-directed | 469 | +6 | 419 / +50 | OGJ, OilPrice, EnergyNow, SquawkNews |
| Gas-directed | 128 | +1 | 127 / +1 | OGJ, EnergyNow, SquawkNews |
| Miscellaneous | 10 | −1 | Not stated as an official year-ago total in the reports cited | OilPrice, EnergyNow |
| Land | 591 | +4 | Not stated | OGJ |
| Inland waters | 1 | 0 | Not stated | OGJ |
| Offshore (U.S.) | 15 | +2 | Not stated | OGJ, EnergyNow |
| Gulf of Mexico | 14 | +2 | Not stated | EnergyNow |
| Canada total | 231 | −2 | 195 / +36 | Baker Hughes overview; OGJ |
| Canada oil | 159 | −5 | Not used in the body | OGJ |
| Canada gas | 70 | +3 | Not used in the body | OGJ |
Oil 469 + gas 128 + miscellaneous 10 = 607. Land 591 + inland waters 1 + offshore 15 = 607.
Table C2. Baker Hughes state figures reported this week
| State | This week | Week change | Year change (if reported) | Source |
| Texas | 278 | +1 | +44 (EnergyNow) | OGJ, EnergyNow |
| New Mexico | 103 | +1 | Not stated in those reports | OGJ, EnergyNow |
| Louisiana | 39 | +2 | Not stated in those reports | OGJ, EnergyNow |
| North Dakota | 32 | +1 | Not stated in those reports | OGJ, EnergyNow |
| Utah | 19 | +1 | Not stated in those reports | OGJ, EnergyNow |
| Wyoming | 19 | +1 | Not stated in those reports | OGJ, EnergyNow |
| Alaska | 11 | +1 | Not stated in those reports | OGJ |
Other Baker Hughes state totals were not published in the contemporaneous reports cited. WellDatabase’s full state table is in Appendix D.
Table C3. Baker Hughes named basins (Oil & Gas 360 table)
| Basin | This week | Week change | Year ago / year change (if reported) |
| Ardmore Woodford | 1 | 0 | Not stated |
| Arkoma Woodford | 0 | 0 | Not stated |
| Barnett | 2 | 0 | Not stated |
| Cana Woodford | 18 | 0 | Not stated |
| DJ-Niobrara | 9 | 0 | Not stated |
| Eagle Ford | 50 | 0 | +9 year over year (OilPrice) |
| Granite Wash | 23 | 0 | Not stated |
| Haynesville | 55 | +2 | 41 / +14 (EnergyNow) |
| Marcellus | 23 | 0 | Not stated |
| Mississippian | 0 | 0 | Not stated |
| Permian | 277 | +2 | 254 / +23 (EnergyNow, OilPrice) |
| Utica | 10 | 0 | Not stated |
| Williston | 35 | 0 | Not stated |
Named basins sum to 503. The official U.S. total is 607, so 104 rigs sit outside that named list (arithmetic from the published figures, not a printed “Other” line). The named basins account for +4 of the official +6 U.S. change, which implies +2 in the residual; that too is arithmetic. Oil & Gas 360 also wrote that “All other regions saw no net change in the active rig count,” which conflicts with that arithmetic and is not used.
Appendix D. WellDatabase Tables
All figures below are from the WellDatabase U.S. Rig Report dated 11.21.2026, read without rounding. Current = previous week + week change, and current = previous year + year change, in every row. State, well-type, wellbore, depth and basin tables each sum to 610; week changes sum to +3; year changes sum to +60.
Table D1. Operators
| Operator | Current | +/− week | Previous week | +/− year | Previous year |
| Unknown | 26 | −7 | 33 | +3 | 23 |
| EOG Resources | 21 | +2 | 19 | −3 | 24 |
| Continental Resources | 20 | 0 | 20 | +9 | 11 |
| Diamondback Energy | 19 | −1 | 20 | +5 | 14 |
| Pioneer Natural Resources | 19 | +2 | 17 | +1 | 18 |
| Devon Energy Production Company | 18 | −5 | 23 | +3 | 15 |
| Permian Resources Operating LLC | 15 | +1 | 14 | +7 | 8 |
| Chevron | 13 | +3 | 10 | +6 | 7 |
| Mack Energy | 13 | +5 | 8 | +13 | 0 |
| Validus Energy II Midcon LLC | 12 | 0 | 12 | +9 | 3 |
Table D2. States (sum 610)
| State | Current | +/− week | Previous week | +/− year | Previous year |
| Alaska | 11 | +1 | 10 | +2 | 9 |
| California | 5 | 0 | 5 | −3 | 8 |
| Colorado | 11 | 0 | 11 | −2 | 13 |
| Louisiana | 39 | +2 | 37 | −3 | 42 |
| Michigan | 1 | 0 | 1 | 0 | 1 |
| Mississippi | 0 | 0 | 0 | −1 | 1 |
| Montana | 3 | −1 | 4 | +1 | 2 |
| Nevada | 2 | −1 | 3 | 0 | 2 |
| New Mexico | 103 | +1 | 102 | −3 | 106 |
| North Dakota | 35 | −2 | 37 | +2 | 33 |
| Ohio | 9 | 0 | 9 | −4 | 13 |
| Oklahoma | 49 | 0 | 49 | +8 | 41 |
| Oregon | 2 | 0 | 2 | +2 | 0 |
| Pennsylvania | 15 | 0 | 15 | −3 | 18 |
| Texas | 278 | +1 | 277 | +52 | 226 |
| Utah | 19 | +1 | 18 | +6 | 13 |
| West Virginia | 9 | 0 | 9 | +2 | 7 |
| Wyoming | 19 | +1 | 18 | +4 | 15 |
Table D3. Well type (sum 610)
| Well type | Current | +/− week | Previous week | +/− year | Previous year |
| Undisclosed | 35 | −2 | 37 | +2 | 33 |
| Gas | 124 | +1 | 123 | −6 | 130 |
| Oil | 441 | +5 | 436 | +59 | 382 |
| Thermal | 10 | 0 | 10 | +5 | 5 |
| Unknown | 0 | −1 | 1 | 0 | 0 |
Table D4. Wellbore (sum 610)
| Wellbore | Current | +/− week | Previous week | +/− year | Previous year |
| Directional | 47 | −1 | 48 | −13 | 60 |
| Horizontal | 506 | +6 | 500 | +28 | 478 |
| Unknown | 3 | −1 | 4 | +3 | 0 |
| Vertical | 54 | −1 | 55 | +42 | 12 |
Table D5. Depth range (sum 610)
| Depth range | Current | +/− week | Previous week | +/− year | Previous year |
| Undisclosed | 35 | −2 | 37 | +2 | 33 |
| > 20k ft | 113 | 0 | 113 | −1 | 114 |
| 15k – 20k ft | 80 | +1 | 79 | +15 | 65 |
| < 5k ft | 20 | +2 | 18 | +5 | 15 |
| 5k – 10k ft | 120 | +1 | 119 | +26 | 94 |
| 10k – 15k ft | 242 | +1 | 241 | +13 | 229 |
Table D6. Basins (sum 610; “Williston” as capitalized in the source table)
| Basin | Current | +/− week | Previous week | +/− year | Previous year |
| Ardmore Woodford | 1 | 0 | 1 | −2 | 3 |
| Arkoma Woodford | 0 | 0 | 0 | −2 | 2 |
| Barnett | 2 | 0 | 2 | 0 | 2 |
| Cana Woodford | 18 | 0 | 18 | +1 | 17 |
| DJ-Niobrara | 9 | 0 | 9 | 0 | 9 |
| Eagle Ford | 50 | 0 | 50 | +11 | 39 |
| Granite Wash | 23 | 0 | 23 | +11 | 12 |
| Haynesville | 55 | +2 | 53 | +14 | 41 |
| Marcellus | 23 | 0 | 23 | −1 | 24 |
| Mississippian | 0 | 0 | 0 | −1 | 1 |
| Other | 104 | +2 | 102 | +4 | 100 |
| Permian | 277 | +2 | 275 | +26 | 251 |
| Utica | 10 | 0 | 10 | −4 | 14 |
| Williston | 38 | −3 | 41 | +3 | 35 |
The PDF’s page-2 county and basin charts and pie charts do not carry readable current numeric labels. No county-level counts are used in this article.
Appendix E. Enverus Daily Basin Table
From the public Daily Rig Count dashboard, read November 21, 2026, last updated November 20, 2026. Daily U.S. totals for November 13 through November 20: 660, 664, 664, 656, 653, 661, 658, 653. Dashboard headline: 653, −1% from the prior week.
Table E. Enverus daily counts by play, Nov. 13–20, 2026
| Play | 11/13 | 11/14 | 11/15 | 11/16 | 11/17 | 11/18 | 11/19 | 11/20 | 1-day | 1-month | 1-year |
| Anadarko Basin | 66 | 66 | 65 | 65 | 63 | 63 | 64 | 64 | 0 | +1 (1.6%) | +18 (39.1%) |
| Appalachia | 31 | 31 | 31 | 32 | 31 | 30 | 31 | 32 | +1 | +2 (6.7%) | −4 (−11.1%) |
| DJ Basin | 9 | 9 | 10 | 8 | 10 | 10 | 11 | 11 | 0 | 0 | +1 (10%) |
| Gulf Coast (incl. Eagle Ford) | 75 | 75 | 75 | 76 | 76 | 76 | 76 | 75 | −1 | +4 (5.6%) | +11 (17.2%) |
| Permian | 250 | 253 | 254 | 249 | 250 | 254 | 251 | 249 | −2 | −5 (−2%) | +21 (9.2%) |
| Williston Basin | 35 | 35 | 35 | 35 | 35 | 36 | 36 | 36 | 0 | +1 (2.9%) | +5 (16.1%) |
| Other | 194 | 195 | 194 | 191 | 188 | 192 | 189 | 186 | −3 | −8 (−4.1%) | +29 (18.5%) |
| Total | 660 | 664 | 664 | 656 | 653 | 661 | 658 | 653 | −5 | −5 (−0.8%) | +81 (14.2%) |
November 20 basin sum: 64 + 32 + 11 + 75 + 249 + 36 + 186 = 653. The dashboard can revise recent days.
The post Energy News Beat Weekly Rig Report – Comparing Baker Hughes, Enverus and WellDatabase as Weekly Counts Rise and the Daily Count Eases appeared first on Energy News Beat.