The likely first hurricane of 2026 is forecast to cross deepwater fields that pump about 15% of U.S. crude and reach the coast late Friday.
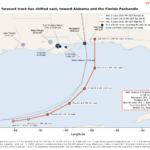
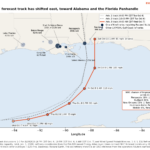
The latest NHC track has shifted east toward Alabama and the Florida Panhandle, which lowers the odds for the Mississippi River refining corridor. It does not take Pascagoula, the Colonial Pipeline or thin East Coast diesel stocks out of play.
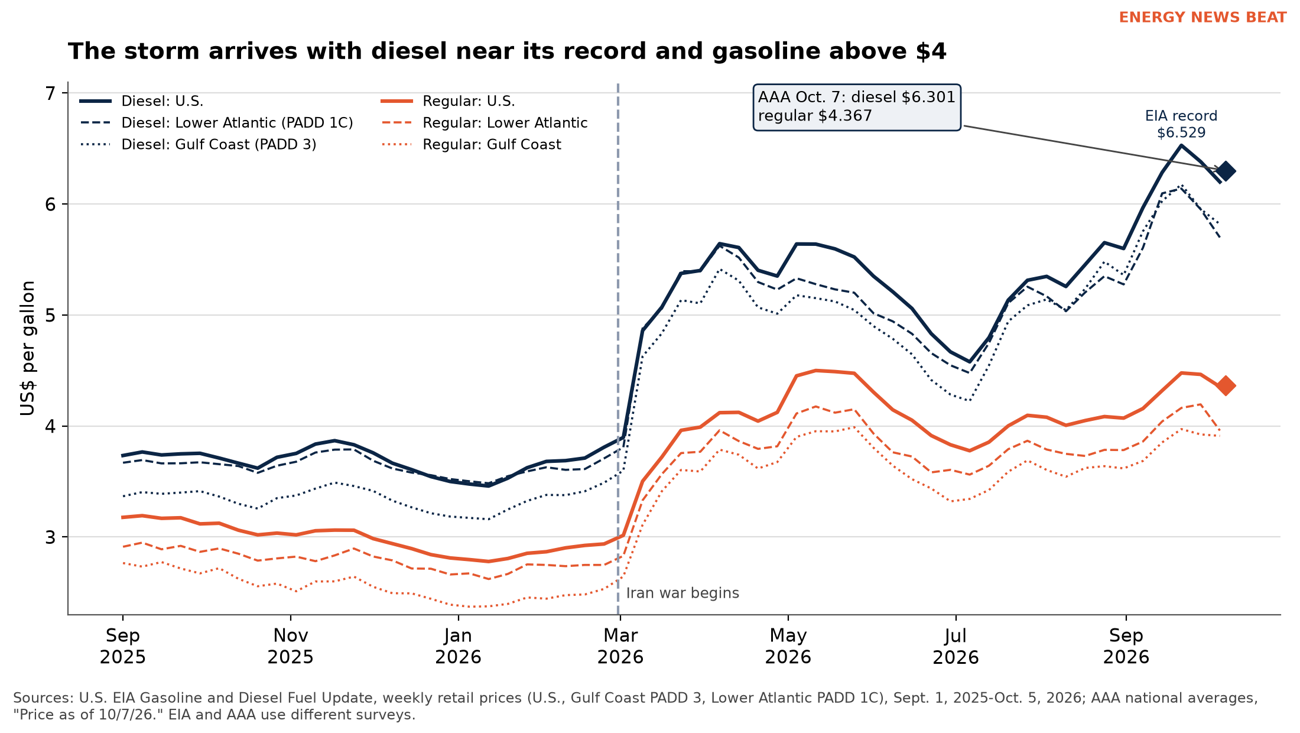
The 2026 Atlantic season has produced eight named storms and not one hurricane. Tropical Storm Isaias, the ninth, is about to end that streak in the worst possible place for fuel markets (weather.com). It formed overnight in the southwestern Gulf, and the National Hurricane Center expects it to become a hurricane Thursday and approach the northern Gulf Coast Friday. It arrives with the U.S. average for diesel at $6.302 a gallon, about 23 cents below the record AAA logged on Sept. 22, and regular gasoline at $4.367 (AAA).
The timing could hardly be worse. Brent traded at $101.02 and WTI at $89.46 early Wednesday (CNBC), held up by Iran’s tanker attacks around Hormuz and Houthi strikes on Saudi Arabia (ENB, Oct. 6). EIA says East Coast distillate inventories were 32% below their five-year seasonal average in September, and it expects retail diesel to stay above $6 a gallon in October (EIA).
Where Isaias is headed
At NHC’s 4 a.m. CDT advisory (Advisory 3), Isaias had 40 mph winds and sat about 580 miles southwest of the mouth of the Mississippi River, moving east-northeast at 8 mph. NHC forecasts rapid strengthening to a peak of 110 mph, Category 2, early Friday over the central Gulf. It “is looking more likely that Isaias will be a significant hurricane when it reaches the coast,” the forecast discussion said. No watches or warnings were up yet, but hurricane watches “will likely be required” for part of the northern Gulf Coast later Wednesday.
For refiners, the key change came overnight. Tuesday’s coverage had the storm “speeding towards Louisiana and Mississippi” (Reuters). NHC’s 4 a.m. forecast moved the track east. It puts the center at 27.7°N, 87.7°W at 1 p.m. Friday and inland over southwest Alabama, with 85 mph winds, by 1 a.m. Saturday (Chart 1). NHC now gives Pensacola a 56% chance of tropical-storm-force winds and Mobile 47%. New Orleans is at 11% and Baton Rouge 4% (NHC wind probabilities). NHC also calls its track confidence “below-average.” AI models sit on the east side of the guidance and physics-based models on the west, so expect more shifts.
What’s in the path
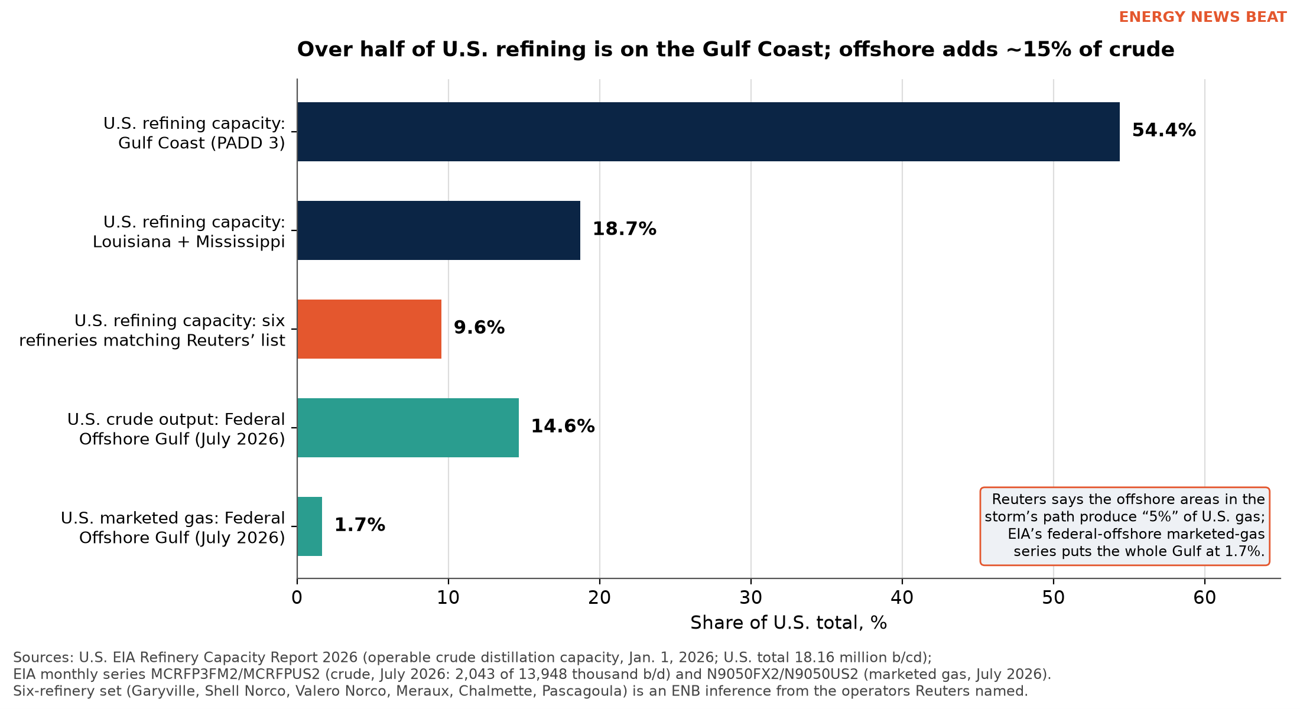
Offshore, Isaias will cross the heart of the deepwater Gulf. Federal offshore fields produced 2.04 million b/d of crude in July, 14.6% of U.S. output (EIA) (Chart 2).
That matches Reuters’ figure that the offshore areas in the storm’s path produce 15% of U.S. crude (Reuters). Reuters’ figure of 5% of U.S. natural gas doesn’t match EIA data, which puts all federal offshore Gulf marketed gas at about 1.7% of the U.S. total (EIA; Appendix F).
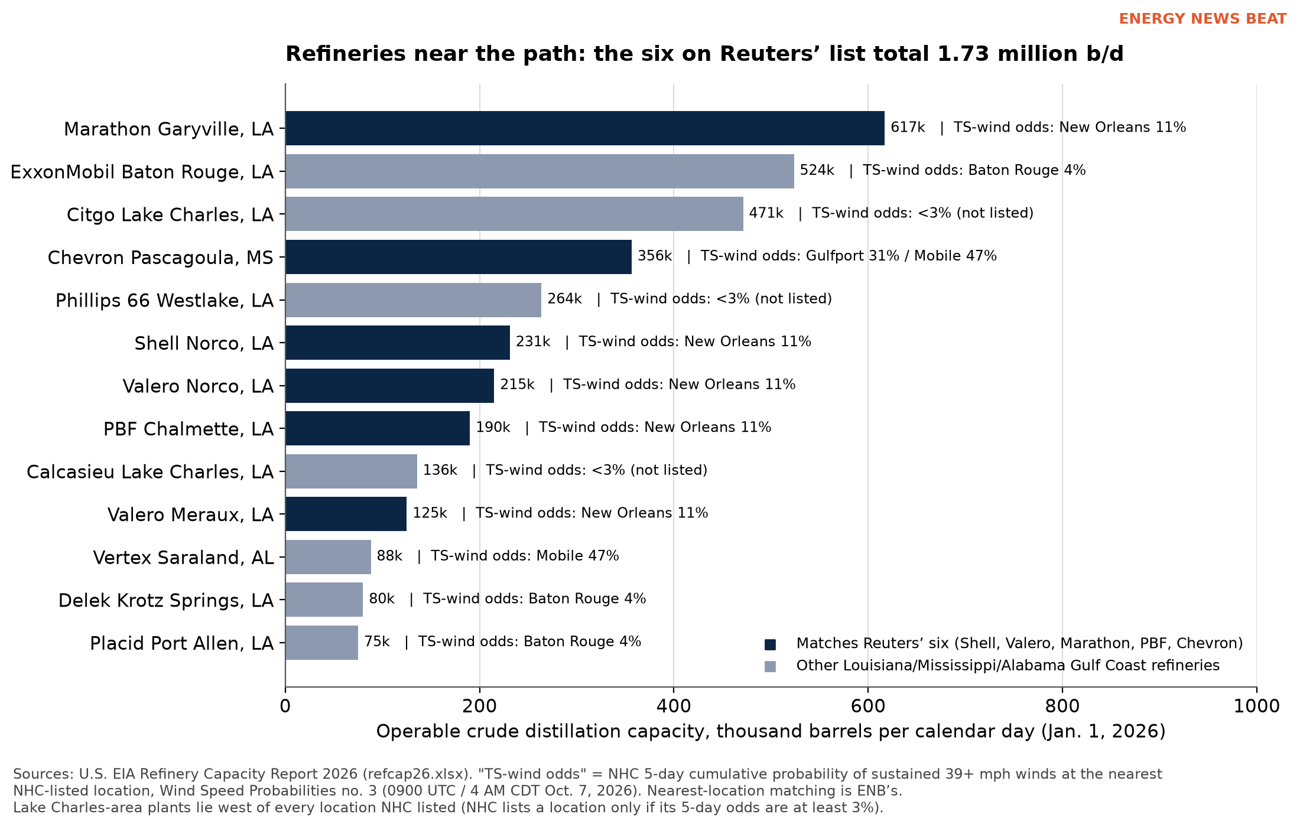
Onshore, the Gulf Coast (PADD 3) holds 54.4% of U.S. refining capacity: 9.88 million of 18.16 million barrels per calendar day (EIA Refinery Capacity Report 2026). Reuters said six refineries run by Shell, Valero, Marathon, PBF and Chevron could be affected but did not name them. In EIA’s list, exactly six plants run by those companies sit on the eastern Louisiana and Mississippi coast: Marathon Garyville (617,000 b/d), Chevron Pascagoula (356,440), Shell Norco (231,153), Valero’s plant at Norco (215,000), PBF Chalmette (190,000) and Valero Meraux (125,000). Together they total 1.73 million b/d, about 9.6% of U.S. capacity (Chart 3). The match is ENB’s inference, not Reuters’.
The eastward shift helps the five Mississippi River plants in that group. They would now sit on the storm’s western side, while NHC warns that rain and wind will “extend far from the center on the eastern side.” Chevron’s Pascagoula refinery and Vertex’s 88,000 b/d plant at Saraland, near Mobile, are the closest to the forecast track. Chevron said its onshore facilities are “following our storm preparedness procedures” (Chevron).
What’s already shut in
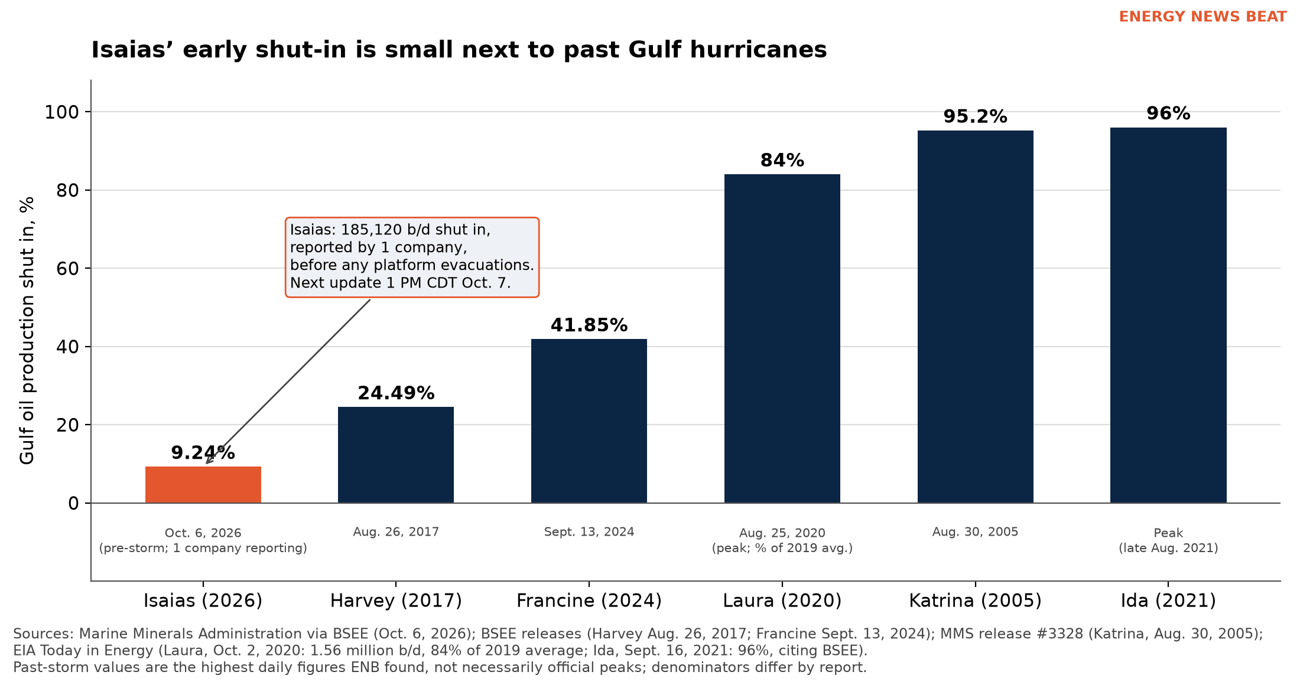
Producers moved early. The Marine Minerals Administration, which took over the work of BSEE and BOEM in July, estimated Tuesday that 185,120 b/d of oil, 9.24% of Gulf output, and 3.36% of gas output were shut in (MMA/BSEE). That estimate rests on one company’s reports as of 11:30 a.m. CDT Tuesday, and no platforms had been evacuated at that point. Shell began evacuating non-essential workers from Stones, Mars, Olympus, Ursa, Vito and Appomattox (Reuters via LSE). Chevron is moving non-essential staff off its platforms but said production “remains at normal levels” (Chevron). BP is removing non-essential workers too (CNN via KVIA). MMA’s next update is due at 1 p.m. CDT Wednesday.
For scale: Ida shut in 96% of Gulf crude in 2021 (EIA), Katrina 95% in 2005 (MMS), and Laura 1.56 million b/d, or 84%, in 2020 (Chart 4). Production from undamaged platforms usually restarts a few days after landfall, but damage can keep it offline for months (EIA).
What it could mean at the pump
No forecaster or analyst ENB found has put a cents-per-gallon figure on Isaias, and ENB won’t invent one. History says the answer depends on refineries and pipelines more than platforms. Harvey cut Gulf Coast refinery inputs 34% in 2017, and the U.S. average for regular rose 28 cents in a week (EIA). Katrina and Rita in 2005 briefly closed about a third of U.S. refining capacity, and regular hit a then-record $3.06 (CRS). Ida was different. It shut in 96% of offshore crude and disrupted at least nine refineries (EIA), yet U.S. regular rose only about 3 cents over the next three weeks. Laura’s storm-period rise was 4 cents (ENB calculation from EIA weekly data; Appendix E).
What’s different now is the cushion. The Iran war has cut Middle East supply and damaged refineries there, and diesel is up 68% since Feb. 27, from $3.76 to $6.32 a gallon (CNBC). U.S. refineries ran at 92.5% of capacity in the week ended Sept. 25, and Gulf Coast plants at 95.9% (EIA). That leaves little slack to cover lost runs. Gasoline futures rose about 2% overnight, roughly twice crude’s gain, according to CNBC market data cited by TickerGrove.
Who gets hit hardest
- Gulf Coast drivers start from the cheapest pumps in the country. Regular is $3.942 in Louisiana, $3.942 in Mississippi and $3.984 in Alabama (AAA). Their near-term risk is evacuation demand, power outages and dry stations, not just price.
- The Southeast and East Coast depend on Gulf Coast refineries. EIA says no refineries between Alabama and Pennsylvania make substantial amounts of transportation fuel. The 2.5 million b/d Colonial Pipeline carries Gulf fuel from Houston to New York Harbor and usually runs at or near capacity (EIA). Harvey forced Colonial to curtail flows (EIA), and power outages after Hurricane Nicholas in 2021 shut two of its lines (EIA). NHC expects 1 to 3 inches of rain as far as the Tennessee Valley and the Carolinas. ENB found no Colonial statement on Isaias.
- Truckers and farmers pay $6.301 for diesel in the middle of harvest. Goldman Sachs notes that farmers buy fuel “disproportionately in the fall,” and Moody’s Mark Zandi estimates each sustained $1 rise in diesel adds about 0.1 point to inflation (CNBC). With East Coast distillate stocks 32% below normal (EIA), any lost Gulf diesel output would show up fastest in the Northeast and Mid-Atlantic. Diesel is already $6.545 in Pennsylvania and $6.516 in New York (AAA).
What to watch
In order: NHC’s 10 a.m. CDT advisory and the expected hurricane watches; MMA’s 1 p.m. shut-in count; any run cuts announced at Pascagoula, Garyville or the Norco plants; and Colonial’s operating notices. The real price story starts after landfall, when crews get back into the plants. If they find flood damage or lost power, the pump impact could last weeks, as it did after Katrina and Harvey. If the plants restart quickly, Isaias may barely register on prices that are already set by Hormuz. ENB will follow up once operators report damage assessments.
All sources, a key-figures table, NHC advisory history, asset lists, historical comparisons, and our notes on conflicting figures follow in the appendices.
We’ll cover this on the next Energy News Beat Stand Up.
Check out the World’s Greatest Podcast Show Notes at EnergyNewsBeat.co or EnergyNewsBeat.com. And subscribe to: The Energy News Beat Substack.
Appendix A. Sources (all accessed Oct. 7, 2026, between about 6:20 and 6:40 a.m. CT)
National Hurricane Center (primary storm data)
- NHC, Tropical Storm Isaias Public Advisory Number 3, 4:00 AM CDT Wed Oct. 7, 2026 (0900 UTC). https://www.nhc.noaa.gov/text/refresh/MIATCPAT4+shtml/070852.shtml Accessed Oct. 7, 2026.
- NHC, Tropical Storm Isaias Forecast Discussion Number 3, 4:00 AM CDT Oct. 7, 2026 (forecaster Papin). https://www.nhc.noaa.gov/text/refresh/MIATCDAT4+shtml/070857.shtml Accessed Oct. 7, 2026.
- NHC, Tropical Storm Isaias Forecast/Advisory Number 3, 0900 UTC Oct. 7, 2026 (wind radii, track error note). https://www.nhc.noaa.gov/text/refresh/MIATCMAT4+shtml/070849.shtml Accessed Oct. 7, 2026.
- NHC, Tropical Storm Isaias Wind Speed Probabilities Number 3, 0900 UTC Oct. 7, 2026. https://www.nhc.noaa.gov/text/refresh/MIAPWSAT4+shtml/070852.shtml Accessed Oct. 7, 2026.
- NHC, Tropical Storm Isaias graphics page (official cone), updated 0922 UTC Oct. 7, 2026. https://www.nhc.noaa.gov/refresh/graphics_at4+shtml/092226.shtml?cone Accessed Oct. 7, 2026.
- NHC, Tropical Depression Nine Public Advisory Number 1, 4:00 PM CDT Oct. 6, 2026. https://www.nhc.noaa.gov/archive/2026/al09/al092026.public.001.shtml Accessed Oct. 7, 2026.
- NHC, Tropical Depression Nine Discussion Number 1, 4:00 PM CDT Oct. 6, 2026 (forecaster Cangialosi). https://www.nhc.noaa.gov/archive/2026/al09/al092026.discus.001.shtml Accessed Oct. 7, 2026.
- NHC, Tropical Depression Nine Public Advisory Number 2, 10:00 PM CDT Oct. 6, 2026. https://www.nhc.noaa.gov/archive/2026/al09/al092026.public.002.shtml Accessed Oct. 7, 2026.
- NHC, Tropical Depression Nine Discussion Number 2, 10:00 PM CDT Oct. 6, 2026 (forecaster Reinhart). https://www.nhc.noaa.gov/archive/2026/al09/al092026.discus.002.shtml Accessed Oct. 7, 2026.
- NHC, Atlantic RSS feed (used to confirm Advisory 3 was latest; rechecked 6:35 a.m. CDT). https://www.nhc.noaa.gov/index-at.xml Accessed Oct. 7, 2026.
Storm coverage and operator statements
- Reuters (Sumit Saha, Erwin Seba), “US forecasts hurricane later this week in Gulf of Mexico” (Oct. 6, 2026), via Investing.com South Africa. https://za.investing.com/news/commodities-news/us-forecasts-hurricane-later-this-week-in-gulf-of-mexico-4492728 Accessed Oct. 7, 2026.
- Same Reuters story, fuller version incl. Shell and Chevron, via Baird Maritime (Oct. 7, 2026). https://www.bairdmaritime.com/offshore/drilling-production/gulf-of-mexico-energy-infrastructure-under-threat-from-looming-storm Accessed Oct. 7, 2026.
- Marine Minerals Administration via BSEE, “MMA Monitors Gulf of America Oil and Gas Activities in Response to Invest 92L” (Oct. 6, 2026). https://www.bsee.gov/newsroom/latest-news/statements-and-releases/press-releases/mma-monitors-gulf-activities-invest-92l Accessed Oct. 7, 2026.
- Reuters, “Shell evacuating non-essential workers from US Gulf offshore assets” (Oct. 6, 2026), via LSE.co.uk. https://www.lse.co.uk/news/shell-evacuating-non-essential-workers-from-us-gulf-offshore-assets-36vazklgjmyqzw5.html Accessed Oct. 7, 2026.
- Chevron, “Tropical Depression Nine” newsroom statement (Houston, Oct. 6, 2026). https://www.chevron.com/newsroom/2026/q4/october-2026-severe-weather-updates Accessed Oct. 7, 2026.
- CNN (Dakota Smith, Briana Waxman, Chris Dolce), “Tropical Storm Isaias to threaten Gulf Coast as a dangerous hurricane,” via KVIA (Oct. 6–7, 2026). https://kvia.com/environment/cnn-weather-environment/2026/10/06/gulf-coast-faces-hurricane-threat-as-tropical-depression-nine-is-forecast-to-strengthen/ Accessed Oct. 7, 2026.
- The Weather Channel/weather.com, “Tropical Storm Isaias to become significant Gulf hurricane” (Oct. 7, 2026). https://weather.com/2026/10/07/storms/hurricane/tropical-storm-hurricane-isaias-gulf-coast-louisiana-florida Accessed Oct. 7, 2026.
- AccuWeather (Alex Sosnowski), “Tropical Depression 9 forms in Gulf, to become Atlantic’s first hurricane before striking US” (Oct. 6, 2026). https://www.accuweather.com/en/hurricane/tropical-depression-9-forms-in-gulf-to-become-atlantics-first-hurricane-before-striking-us/1942566 Accessed Oct. 7, 2026.
- OilPrice.com (Charles Kennedy), “Chevron, Shell and BP Pull Workers From the Gulf Ahead of Hurricane” (Oct. 7, 2026). Contains an error; see Appendix F. https://oilprice.com/Latest-Energy-News/World-News/Chevron-Shell-and-BP-Pull-Workers-From-the-Gulf-Ahead-of-Hurricane.html Accessed Oct. 7, 2026.
- TickerGrove, “About 9% of Gulf oil output is shut in as forecasters expect a hurricane by Thursday” (Oct. 6, 2026). Used only for the overnight gasoline-futures move. https://tickergrove.com/stories/gulf-oil-output-shut-in-tropical-depression-nine-hurricane-20261006 Accessed Oct. 7, 2026.
Prices and outlook
- AAA Gas Prices, national averages (“Price as of 10/7/26”), incl. record highs. https://gasprices.aaa.com/ Accessed Oct. 7, 2026.
- AAA, State Gas Price Averages (“Price as of 10/7/26”). https://gasprices.aaa.com/state-gas-price-averages/ Accessed Oct. 7, 2026.
- CNBC (Justina Lee), “Oil rises as concerns over Houthi attacks on Saudi Arabia eclipse supply recovery” (Oct. 7, 2026; prices as of 4:48 a.m. ET). https://www.cnbc.com/2026/10/07/oil-prices-today-brent-wti-hormuz.html Accessed Oct. 7, 2026.
- CNBC (Greg Iacurci), “High diesel prices may put ‘another squeeze’ on the consumer, economist says” (Oct. 6, 2026). https://www.cnbc.com/2026/10/06/diesel-prices-inflation.html Accessed Oct. 7, 2026.
- U.S. EIA press release, “EIA expects a mixed picture for winter fuel costs this year” (Oct. 6, 2026; October STEO and Winter Fuels Outlook). https://www.eia.gov/pressroom/releases/press593.php Accessed Oct. 7, 2026.
- U.S. EIA, Gasoline and Diesel Fuel Update (weekly, through Oct. 5, 2026). https://www.eia.gov/petroleum/gasdiesel/ Accessed Oct. 7, 2026.
- Energy News Beat, “Iran’s Tanker Attacks Keep Pump Prices High Even as Gulf Oil Exports Rebound” (Oct. 6, 2026). https://energynewsbeat.com/crude-oil/irans-tanker-attacks-keep-pump-prices-high-even-as-gulf-oil-exports-rebound/ Accessed Oct. 7, 2026.
EIA data series and reports
- U.S. EIA, Refinery Capacity Report 2026 (released June 26, 2026; capacity as of Jan. 1, 2026). https://www.eia.gov/petroleum/refinerycapacity/ Accessed Oct. 7, 2026.
- U.S. EIA, Refinery Capacity Report 2026 data file (refcap26.xlsx). https://www.eia.gov/petroleum/refinerycapacity/refcap26.xlsx Accessed Oct. 7, 2026.
- U.S. EIA, Federal Offshore Gulf of America Field Production of Crude Oil, monthly (MCRFP3FM2), through July 2026. https://www.eia.gov/dnav/pet/hist/LeafHandler.ashx?n=PET&s=MCRFP3FM2&f=M Accessed Oct. 7, 2026.
- U.S. EIA, U.S. Field Production of Crude Oil, monthly (MCRFPUS2), through July 2026. https://www.eia.gov/dnav/pet/hist/LeafHandler.ashx?n=PET&s=MCRFPUS2&f=M Accessed Oct. 7, 2026.
- U.S. EIA, Federal Offshore Gulf of America Natural Gas Marketed Production (N9050FX2), through July 2026. https://www.eia.gov/dnav/ng/hist/n9050fx2m.htm Accessed Oct. 7, 2026.
- U.S. EIA, U.S. Natural Gas Marketed Production (N9050US2), through July 2026. https://www.eia.gov/dnav/ng/hist/n9050us2m.htm Accessed Oct. 7, 2026.
- U.S. EIA, Weekly Gulf Coast (PADD 3) Refinery Utilization (W_NA_YUP_R30_PER), through Sept. 25, 2026. https://www.eia.gov/dnav/pet/hist/LeafHandler.ashx?n=PET&s=W_NA_YUP_R30_PER&f=W Accessed Oct. 7, 2026.
- U.S. EIA, Weekly U.S. Refinery Utilization (WPULEUS3), through Sept. 25, 2026. https://www.eia.gov/dnav/pet/hist/LeafHandler.ashx?n=PET&s=WPULEUS3&f=W Accessed Oct. 7, 2026.
- U.S. EIA, Weekly East Coast (PADD 1) Distillate Stocks (WDISTP11), through Sept. 25, 2026. https://www.eia.gov/dnav/pet/hist/LeafHandler.ashx?n=PET&s=WDISTP11&f=W Accessed Oct. 7, 2026.
Historical comparisons
- U.S. EIA, Today in Energy, “Hurricane Ida disrupted crude oil production and refining activity” (Sept. 16, 2021). https://www.eia.gov/todayinenergy/detail.php?id=49576 Accessed Oct. 7, 2026.
- U.S. EIA, Today in Energy, “Hurricane Harvey caused U.S. Gulf Coast refinery runs to drop, gasoline prices to rise” (Sept. 11, 2017). https://www.eia.gov/todayinenergy/detail.php?id=32852 Accessed Oct. 7, 2026.
- U.S. EIA, Today in Energy, “Hurricane Laura shut in more Gulf of Mexico crude oil production than any storm since 2008” (Oct. 2, 2020). https://www.eia.gov/todayinenergy/detail.php?id=45376 Accessed Oct. 7, 2026.
- U.S. EIA, Today in Energy, “Pipeline shutdown disrupts gasoline supply in the Southeast” (Sept. 21, 2016). https://www.eia.gov/todayinenergy/detail.php?id=28032 Accessed Oct. 7, 2026.
- U.S. EIA, Today in Energy, “Significant volumes of gasoline and distillate move from the Gulf Coast to the East Coast” (June 28, 2022). https://www.eia.gov/todayinenergy/detail.php?id=52919 Accessed Oct. 7, 2026.
- Congressional Research Service, RL33124, “Oil and Gas Disruption From Hurricanes Katrina and Rita” (Oct. 21, 2005–Apr. 6, 2006), via EveryCRSReport. https://www.everycrsreport.com/reports/RL33124.html Accessed Oct. 7, 2026.
- Minerals Management Service, Release #3328, Hurricane Katrina shut-in statistics as of Aug. 30, 2005 (PDF, hosted by BSEE). https://www.bsee.gov/sites/bsee.gov/files/reports/reports/press0830.pdf Accessed Oct. 7, 2026.
- BSEE, Hurricane Harvey Activity Statistics, Aug. 26, 2017. https://www.bsee.gov/newsroom/latest-news/statements-and-releases/press-releases/bsee-hurricane-harvey-activity-0 Accessed Oct. 7, 2026.
- BSEE, Post-Tropical Cyclone Francine release, Sept. 13, 2024. https://www.bsee.gov/newsroom/latest-news/statements-and-releases/press-releases/bsee-monitors-gulf-of-mexico-oil-and-76 Accessed Oct. 7, 2026.
- BSEE, Tropical Storm Francine release, Sept. 11, 2024. https://www.bsee.gov/newsroom/latest-news/statements-and-releases/press-releases/bsee-monitors-gulf-of-america-oil-and-73 Accessed Oct. 7, 2026.
Offshore asset background and mapping
- Shell Offshore (PR Newswire), “Shell starts production at Vito in US Gulf of Mexico” (Feb. 16, 2023). https://www.prnewswire.co.uk/news-releases/shell-starts-production-at-vito-in-us-gulf-of-mexico-301748369.html Accessed Oct. 7, 2026.
- Shell (CNW), “Shell starts production at Stones in the Gulf of Mexico” (Sept. 6, 2016). https://www.newswire.ca/news-releases/shell-starts-production-at-stones-in-the-gulf-of-mexico-592412881.html Accessed Oct. 7, 2026.
- Offshore Magazine, “Appomattox starts up ahead of schedule, under budget” (May 23, 2019). https://www.offshore-mag.com/production/article/14033778/appomattox-starts-up-ahead-of-schedule-under-budget Accessed Oct. 7, 2026.
- Offshore Magazine (Bruce Beaubouef), “Shell expands presence in deepwater GoM with Mars B” (Dec. 12, 2014). https://www.offshore-mag.com/home/article/16804594/shell-expands-presence-in-deepwater-gom-with-mars-b Accessed Oct. 7, 2026.
- Petroleum_Refineries feature service (EIA-820 data, “As of Jan. 1 2017”), used for refinery coordinates only. https://services5.arcgis.com/t4xYDjfDFWC8eyBj/arcgis/rest/services/Petroleum_Refineries/FeatureServer Accessed Oct. 7, 2026.
- Natural Earth vector data (land and state boundaries, 1:50m), basemap for Chart 1. https://github.com/nvkelso/natural-earth-vector Accessed Oct. 7, 2026.
Access notes: Reuters.com was not fetched directly; Reuters wires were read through syndicated copies (Investing.com, Baird Maritime, LSE.co.uk). The Shell U.S. Storm Updates page (shell.us) returned HTTP 500, so the Shell evacuation list comes from Reuters. AP’s Isaias story and EIA’s Ida page timed out in the fetch tool; the EIA page was then read with a direct download, and AP was not used. The Energy Atlas refinery service used for coordinates is an ArcGIS layer of EIA-820 data and is not hosted on eia.gov; it was used for plant locations only, never capacities.
Appendix B. Key figures
| Metric | Value | As of | Source |
| Storm status | Tropical Storm Isaias (AL092026); 40 mph, 1004 mb; 22.0°N 94.1°W; ENE 8 mph | NHC Adv. 3, 4 AM CDT Oct. 7 | NHC |
| Forecast peak | 95 kt / 110 mph (Cat. 2) at 1 AM CDT Fri. Oct. 9 over central Gulf | NHC Adv. 3 | NHC |
| Forecast at coast | 90 kt / 105 mph at 27.7°N 87.7°W, 1 PM CDT Fri.; 75 kt / 85 mph inland at 30.8°N 87.7°W, 1 AM CDT Sat. | NHC Adv. 3 | NHC |
| Watches/warnings | None in effect; hurricane and storm surge watches “will likely be required” later Oct. 7 | NHC Adv. 3 | NHC |
| TS-force wind odds (5-day) | Pensacola 56%, Mobile 47%, Gulfport 31%, Buras 21%, New Orleans 11%, Baton Rouge 4% | NHC PWS 3, 0900 UTC Oct. 7 | NHC |
| Gulf oil shut in | 185,120 b/d (9.24%); gas 72 MMcf/d (3.36%); 1 company reporting; 0 of 371 platforms evacuated | 11:30 AM CDT Oct. 6 | MMA/BSEE |
| Gulf offshore crude output | 2,043 thousand b/d = 14.6% of U.S. 13,948 | July 2026 | EIA |
| Gulf offshore marketed gas | 64,124 MMcf/month = 1.65% of U.S. 3,880,412 | July 2026 | EIA |
| Reuters path shares | 15% of U.S. crude, 5% of U.S. gas (offshore areas in path) | Oct. 6 | Reuters |
| U.S. refining capacity | 18,160,493 b/cd operable; PADD 3 9,876,563 (54.4%) | Jan. 1, 2026 | EIA |
| Louisiana / Mississippi capacity | 3,005,373 (16.5%) / 393,940 (2.2%) b/cd | Jan. 1, 2026 | EIA |
| Six refineries (ENB match) | 1,734,593 b/cd = 9.55% of U.S. | Jan. 1, 2026 | EIA; Reuters |
| Refinery utilization | U.S. 92.5%; Gulf Coast 95.9% | Week ended Sept. 25 | EIA |
| East Coast distillate stocks | 21.9M bbl; ≈32% below 5-yr average | Sept. 25 / Sept. avg. | EIA; EIA |
| AAA regular | $4.3667 (yesterday $4.3685; wk ago $4.4343; yr ago $3.1214) | Oct. 7 | AAA |
| AAA diesel | $6.3015 (yesterday $6.3151; wk ago $6.4139; yr ago $3.6803); record $6.5276 on 9/22/26 | Oct. 7 | AAA |
| EIA weekly retail | U.S. regular $4.354, diesel $6.199; Gulf Coast $3.911 / $5.819; Lower Atlantic $3.959 / $5.699 | Week of Oct. 5 | EIA |
| Crude futures | Brent (Dec.) $101.02 (+0.44%); WTI (Nov.) $89.46 (flat) | 3:48 AM CT Oct. 7 | CNBC |
| Diesel since war | +68%, $3.76 (Feb. 27) → $6.32 (Oct. 6), per AAA | Oct. 6 | CNBC |
| EIA diesel outlook | Retail diesel above $6/gal in October; ~$4.50 avg. in 2027 | Oct. 6 STEO | EIA |
| Colonial Pipeline | 2.5M b/d; Houston to New York Harbor; 29 refineries, 267 terminals | EIA 2016/2017 | EIA; EIA |
Appendix C. NHC advisory history and forecast (all times CDT unless noted)
Latest advisory used: Tropical Storm Isaias Advisory Number 3, issued 4:00 a.m. CDT (0900 UTC) Wednesday, Oct. 7, 2026. NHC said the next complete advisory would be at 10:00 a.m. CDT. ENB rechecked the NHC Atlantic feed at 6:35 a.m. CDT and found no newer product. Because the storm is moving, readers should check NHC for later advisories.
C-1. Advisories issued so far
| Adv. | Issued | Name / status | Center | Max winds | Pressure | Motion | Watches / warnings |
| 1 | 4:00 PM Tue Oct. 6 (2100 UTC) | Tropical Depression Nine | 22.1°N 95.6°W | 35 mph | 1007 mb | E 5 mph | None |
| 2 | 10:00 PM Tue Oct. 6 (0300 UTC) | Tropical Depression Nine | 22.1°N 95.0°W | 35 mph | 1005 mb | E 5 mph | None |
| 3 | 4:00 AM Wed Oct. 7 (0900 UTC) | Tropical Storm Isaias | 22.0°N 94.1°W | 40 mph | 1004 mb | ENE 8 mph | None; hurricane watches likely later today |
C-2. Advisory 3 forecast points
| Hour | Valid (UTC) | Valid (CDT) | Position | Max wind | Note |
| INIT | 2026-10-07 09:00Z | Wed Oct 7, 4 AM CDT | 22.0°N 94.1°W | 35 kt / 40 mph | |
| 12H | 2026-10-07 18:00Z | Wed Oct 7, 1 PM CDT | 22.2°N 92.9°W | 50 kt / 60 mph | |
| 24H | 2026-10-08 06:00Z | Thu Oct 8, 1 AM CDT | 22.7°N 91.4°W | 65 kt / 75 mph | |
| 36H | 2026-10-08 18:00Z | Thu Oct 8, 1 PM CDT | 23.9°N 89.7°W | 80 kt / 90 mph | |
| 48H | 2026-10-09 06:00Z | Fri Oct 9, 1 AM CDT | 25.5°N 88.5°W | 95 kt / 110 mph | |
| 60H | 2026-10-09 18:00Z | Fri Oct 9, 1 PM CDT | 27.7°N 87.7°W | 90 kt / 105 mph | |
| 72H | 2026-10-10 06:00Z | Sat Oct 10, 1 AM CDT | 30.8°N 87.7°W | 75 kt / 85 mph | Inland |
| 96H | 2026-10-11 06:00Z | Sun Oct 11, 1 AM CDT | 38.2°N 87.5°W | 25 kt / 30 mph | Post-tropical, inland |
| 120H | 12/0600Z | Mon Oct 12, 1 AM CDT | — | — | Dissipated |
Source: NHC Forecast Discussion 3. NHC notes day-4 and day-5 track errors average about 125 and 175 nautical miles (Forecast/Advisory 3). The 72-hour point (30.8°N, 87.7°W) falls in southwest Alabama by ENB’s point-in-polygon check against Natural Earth state boundaries. NHC itself does not name a landfall point.
C-3. How the track moved
| Advisory | 72-hour forecast point | 72-h intensity | 96-hour point |
| 1 (4 PM Oct. 6) | 28.5°N 88.3°W, 1 PM CDT Fri. Oct. 9 (offshore) | 85 kt / 100 mph | 34.0°N 88.7°W, inland (Mississippi) |
| 2 (10 PM Oct. 6) | 28.8°N 88.3°W, 7 PM CDT Fri. Oct. 9 (offshore) | 85 kt / 100 mph | 34.1°N 88.8°W, inland (Mississippi) |
| 3 (4 AM Oct. 7) | 30.8°N 87.7°W, 1 AM CDT Sat. Oct. 10 (inland) | 75 kt / 85 mph | 38.2°N 87.5°W, post-tropical (Indiana) |
Discussion 3: “This latest track is a eastward shift compared to the previous forecast, but given large amount of across- and along-track spread users should continue to monitor forecast updates given the below-average track confidence.” Peak intensity forecast rose from 85 kt (Adv. 1 and 2) to 95 kt (Adv. 3).
C-4. NHC 5-day wind-speed probabilities, Advisory 3 (selected locations)
| Location | ≥39 mph (34 kt) | ≥58 mph (50 kt) | ≥74 mph (64 kt) |
| Pensacola FL | 56% | 30% | 9% |
| Whiting Fld FL | 54% | 27% | 8% |
| Mobile AL | 47% | 22% | 6% |
| Destin Exec Ap | 47% | 21% | 5% |
| Panama City FL | 45% | 16% | 7% |
| Montgomery AL | 34% | 10% | 0% |
| Gulfport MS | 31% | 14% | 4% |
| Apalachicola | 29% | 7% | 3% |
| Birmingham AL | 28% | 0% | 0% |
| Stennis MS | 21% | 10% | 2% |
| Buras LA | 21% | 9% | 3% |
| Dothan AL | 19% | 5% | 0% |
| Columbus GA | 11% | 0% | 0% |
| New Orleans LA | 11% | 4% | 1% |
| Jackson MS | 11% | 3% | 0% |
| Tallahassee FL | 6% | 0% | 0% |
| Houma LA | 5% | 3% | 0% |
| St Marks FL | 5% | 0% | 0% |
Source: NHC Wind Speed Probabilities 3, cumulative from 06Z Wed. to 06Z Mon. Offshore grid points: 29°N 87°W shows 75% / 50% / 30%, and 28°N 89°W, roughly where the Mississippi Canyon deepwater fields lie (ENB approximation), shows 50% / 28% / 18%. Hazards per Advisory 3: rainfall of 3–6 in., locally 10 in., from far southeastern Louisiana to the Florida Panhandle Friday through the weekend, and 1–3 in. (locally 5) across the Southeast to the Tennessee Valley and Carolinas.
Appendix D. Refineries and offshore assets in or near the path
D-1. Louisiana, Mississippi and Alabama Gulf Coast refineries (EIA “Louisiana Gulf Coast” refining district)
| Operator (EIA corporation) | Site, state | Capacity b/cd | % of U.S. | Reuters six?* | Nearest NHC point (TS-wind odds) |
| Marathon Petroleum | Garyville, Louisiana | 617,000 | 3.40% | Yes | New Orleans LA |
| ExxonMobil | Baton Rouge, Louisiana | 523,500 | 2.88% | — | Baton Rouge LA |
| PDV America (Citgo) | Lake Charles, Louisiana | 471,200 | 2.59% | — | (not listed; <3%) |
| Chevron | Pascagoula, Mississippi | 356,440 | 1.96% | Yes | Gulfport MS / Mobile AL |
| Phillips 66 | Westlake, Louisiana | 263,700 | 1.45% | — | (not listed; <3%) |
| Shell plc | Norco, Louisiana | 231,153 | 1.27% | Yes | New Orleans LA |
| Valero Energy | Norco, Louisiana | 215,000 | 1.18% | Yes | New Orleans LA |
| PBF Energy | Chalmette, Louisiana | 190,000 | 1.05% | Yes | New Orleans LA |
| Transworld Oil USA (Calcasieu Refining) | Lake Charles, Louisiana | 135,500 | 0.75% | — | (not listed; <3%) |
| Valero Energy | Meraux, Louisiana | 125,000 | 0.69% | Yes | New Orleans LA |
| Vertex Energy | Saraland, Alabama | 88,000 | 0.48% | — | Mobile AL |
| Delek (Alon Krotz Springs) | Krotz Springs, Louisiana | 80,000 | 0.44% | — | Baton Rouge LA |
| Placid Oil | Port Allen, Louisiana | 75,000 | 0.41% | — | Baton Rouge LA |
Source: EIA Refinery Capacity Report 2026, atmospheric crude distillation operable capacity, barrels per calendar day, Jan. 1, 2026. *ENB inference: the only plants in the area run by the five operators Reuters named. ExxonMobil Baton Rouge (523,500 b/cd) is in the area, but ExxonMobil was not among the operators Reuters named. Inland plants (Ergon Vicksburg 26,500; Hunt Tuscaloosa 50,000; Hunt Sandersville 11,000; Goodway Atmore 4,100) sit in EIA’s North Louisiana-Arkansas district. Status today: no refinery shutdowns or run cuts for Isaias had been reported by any source ENB reviewed as of 6:40 a.m. CT.
D-2. Offshore assets named by operators
| Asset / operator | Status for Isaias | Background | Source |
| Mars (Shell) | Non-essential staff evacuating (Oct. 6) | Mississippi Canyon, ~3,000 ft of water, ~130 mi south of New Orleans (Mars B description) | Reuters/LSE; Offshore |
| Olympus (Shell), Mars B TLP | Evacuating non-essential staff | Moored ~1 mi from Mars platform; Shell’s largest GoM TLP | Reuters/LSE; Offshore |
| Ursa (Shell) | Evacuating non-essential staff | Location not independently sourced by ENB | Reuters/LSE |
| Vito (Shell 63.11%, Equinor) | Evacuating non-essential staff | Mississippi Canyon, >4,000 ft; ~150 mi SE of New Orleans, 10 mi south of Mars; 100,000 boe/d est. peak | Reuters/LSE; Shell |
| Appomattox (Shell 79%, CNOOC) | Evacuating non-essential staff | ~80 mi SE of Louisiana, ~7,400 ft; 175,000 boe/d est. peak | Reuters/LSE; Offshore |
| Stones (Shell 100%), FPSO | Evacuating non-essential staff | ~9,500 ft; FPSO can disconnect and sail away in a hurricane | Reuters/LSE; Shell |
| Chevron-operated Gulf platforms | Non-essential staff moving; production normal | Assets not itemized | Chevron |
| BP Gulf facilities | Removing non-essential workers; securing facilities | Assets not itemized | CNN/KVIA |
Production rates by platform are not public in real time; the company “peak” figures above are design estimates from start-up announcements, not current output. MMA does not identify which company’s shut-ins make up its Oct. 6 estimate.
D-3. Pipelines
Colonial Pipeline: 2.5 million b/d, about 5,500 miles, from Houston to New York Harbor, connecting 29 refineries and 267 terminals. Line 1 carries about 1.4 million b/d of gasoline to Greensboro, N.C.; Line 2 carries about 1.1 million b/d of diesel, heating oil and jet fuel (EIA, 2016). Products (SE) Pipeline (formerly Plantation): 720,000 b/d (EIA, 2022); EIA’s 2016 article gave 700,000 b/d. In March 2022, the East Coast received 1.9 million b/d of gasoline and 0.9 million b/d of distillate from the Gulf Coast by pipeline, tanker and barge (EIA). ENB found no Colonial operational notice tied to Isaias as of publication.
Appendix E. Historical hurricane comparisons
| Storm | Landfall | Offshore oil shut in | Refinery / pipeline impact | Price note | Sources |
| Katrina | Aug. 29, 2005, LA/MS | 95.20% (1.43M b/d) on Aug. 30 | Most Gulf output halted; LA/AL refining hit; 554,000 b/d still shut late Oct.; Colonial outage | Regular peaked at a record $3.06 on Sept. 5; MD and DC briefly highest in U.S. | MMS; CRS |
| Rita | Sept. 24, 2005, TX/LA | (combined with Katrina) | 4.8M b/d more refining closed; 5.6M b/d (~1/3 of U.S.) shut just after | Katrina+Rita: 163M bbl offshore output lost over 298 days | CRS; EIA |
| Harvey | Aug. 25, 2017, TX | 24.49% on Aug. 26 | Gulf Coast refinery inputs −3.2M b/d (−34%); utilization 96%→63%; Colonial curtailed | U.S. regular +28¢ (Aug. 28–Sept. 4); Gulf Coast +35¢ | BSEE; EIA |
| Laura | Aug. 27, 2020, LA | 1.56M b/d (84% of 2019 avg.) on Aug. 25 | Not covered in the EIA source used (offshore-focused) | 14.4M bbl offshore output lost over 15 days; nearly half of 643 platforms evacuated | EIA |
| Ida | Aug. 29, 2021, LA (Cat. 4) | 96% (crude), 94% (gas) | ≥9 refineries shut or cut; Gulf Coast inputs −1.6M b/d; Sept. runs −713,000 b/d (EIA est.) | Colonial shut two lines after Nicholas (Sept. 14) power outages | EIA |
| Francine | Sept. 11, 2024, LA | 41.85% (732,316 b/d) on Sept. 13 | Not covered in sources reviewed | — | BSEE |
E-2. ENB calculation: U.S. weekly retail price change around landfall
| Storm | Landfall | Base EIA week | Regular (3 wks) | Reg. Δ | Diesel (3 wks) | Diesel Δ |
| Katrina | 2005-08-29 | 2005-08-29 | $2.610 → max $3.069 | +45.9¢ | $2.590 → max $2.898 | +30.8¢ |
| Rita | 2005-09-24 | 2005-09-19 | $2.786 → max $2.928 | +14.2¢ | $2.732 → max $3.150 | +41.8¢ |
| Gustav | 2008-09-01 | 2008-09-01 | $3.680 → max $3.835 | +15.5¢ | $4.121 → max $4.059 | -6.2¢ |
| Ike | 2008-09-13 | 2008-09-08 | $3.648 → max $3.835 | +18.7¢ | $4.059 → max $4.023 | -3.6¢ |
| Harvey | 2017-08-25 | 2017-08-21 | $2.360 → max $2.685 | +32.5¢ | $2.596 → max $2.802 | +20.6¢ |
| Laura | 2020-08-27 | 2020-08-24 | $2.182 → max $2.222 | +4.0¢ | $2.426 → max $2.441 | +1.5¢ |
| Ida | 2021-08-29 | 2021-08-23 | $3.145 → max $3.176 | +3.1¢ | $3.324 → max $3.373 | +4.9¢ |
| Francine | 2024-09-11 | 2024-09-09 | $3.236 → max $3.185 | -5.1¢ | $3.555 → max $3.544 | -1.1¢ |
Method: base = last EIA weekly U.S. reading (Monday survey) on or before landfall; Δ = highest of the next three weekly readings minus base. For Katrina the base week is the landfall Monday (Aug. 29, 2005). Crude prices and other factors moved too: 2008 (Gustav/Ike) coincided with the financial crisis, and 2020 (Laura) with pandemic demand. These are correlations, not storm effects, and are not a forecast for Isaias. Landfall dates for Katrina, Rita, Laura and Ida come from the cited CRS/EIA sources; dates for Gustav, Ike, Harvey and Francine are standard NHC record dates that ENB did not re-fetch for this piece. Sources: EIA gasoline weekly series EMM_EPMR_PTE_NUS_DPG and EMD_EPD2D_PTE_NUS_DPG.
The post Tropical Storm Isaias Threatens Gulf Oil and Refineries With Diesel Already Near a Record appeared first on Energy News Beat.